
Exploring collective attentions
Humanities and Social Sciences are not immune to the intense dynamics of digitization of data, their analysis and the means of their transmission. The tracking of social practices is also an opportunity to better understand the powerful social, economic and political change that has taken place in recent years. In order to contribute to the enhancement and clarification of this issue for humanities and social sciences, we propose to focus on one of its most emblematic demonstrations, in addition to being one of the most visited Internet sites: Wikipedia.
This exploratory project aims to extend the initiatives that have contributed to making Wikipedia more accessible and intelligible, by simplifying the exploitation of its potential. In particular, this project focuses on valuing the traces of the consultation of the pages, as so many elementary acts that involve collective attention and inform us of what matters. More specifically, by considering languages, time and space, it is thus possible to better characterize regimes of attention and the relative globality of social facts (attacks, elections, conspiracy theories, controversies, sports or cultural events...).
Time
12 years of data
≃ 4400 days
Languages
40 editions of Wikipedia
English, French, Spanish, German, Italian, Portuguese, Mandarin, Japanese, Russian...
Spatial
All the World
≃ 8.4 million pages
Details
Precision up to just 10 views per year.
From global view
to street view
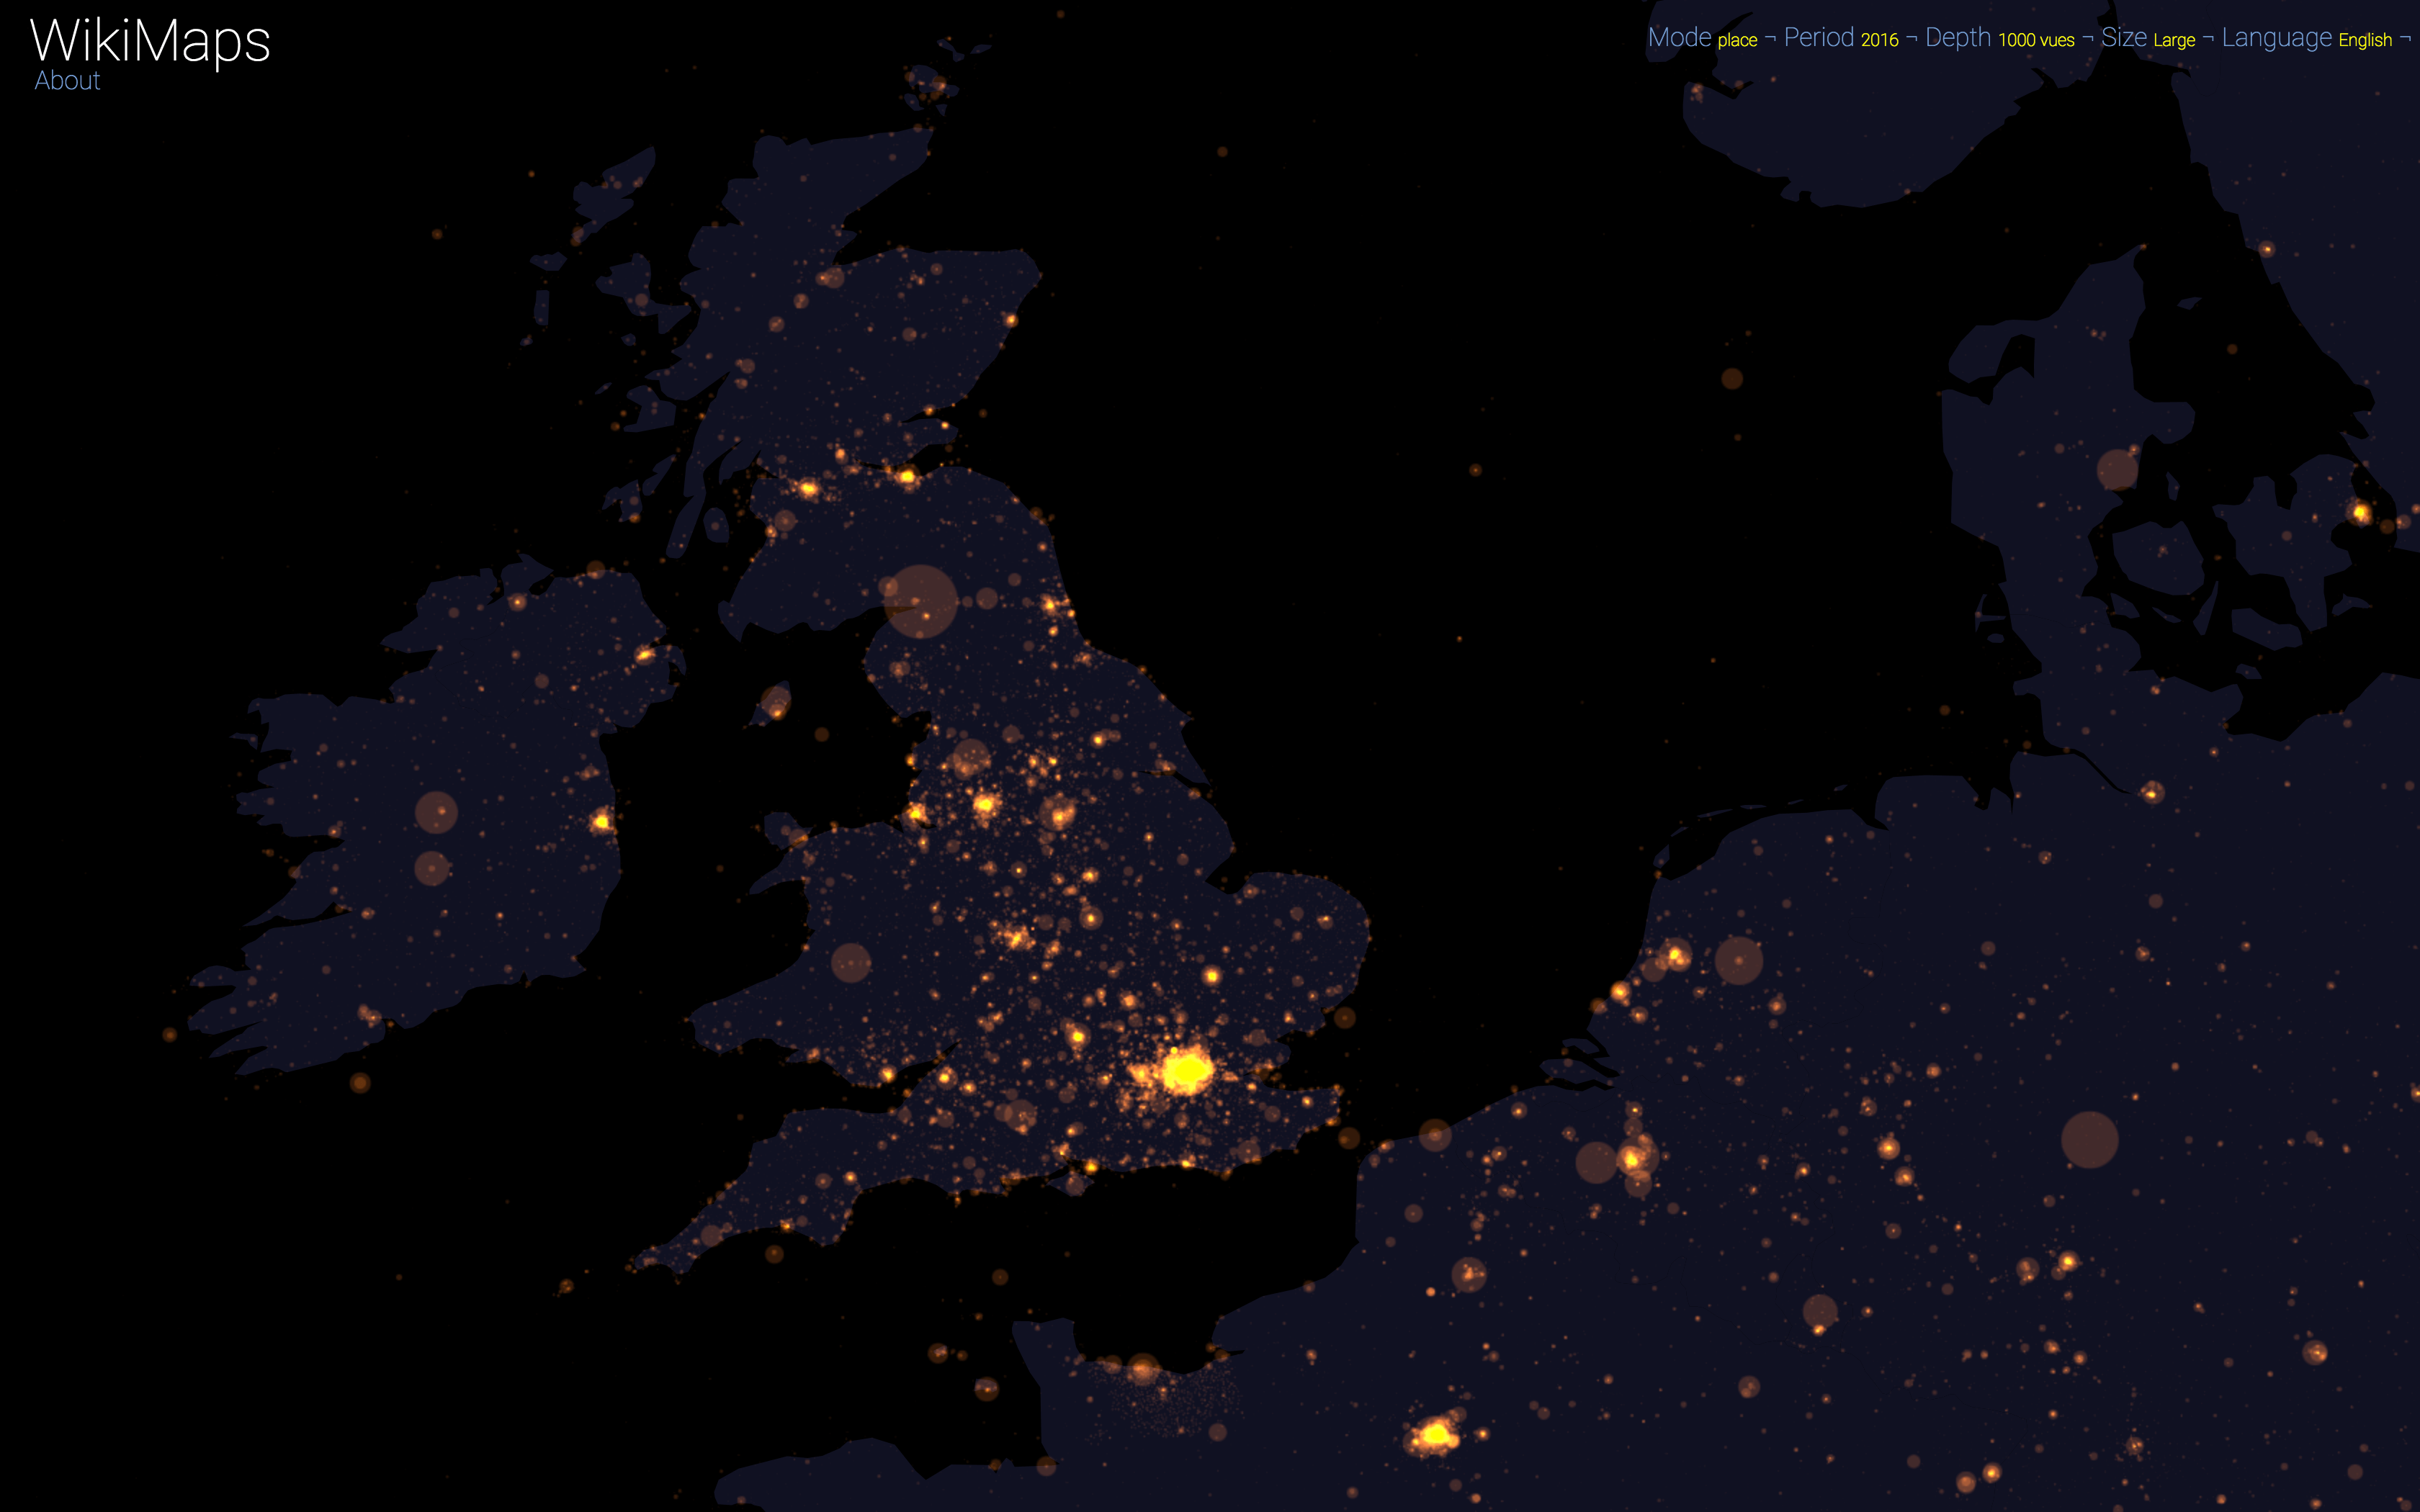
Language
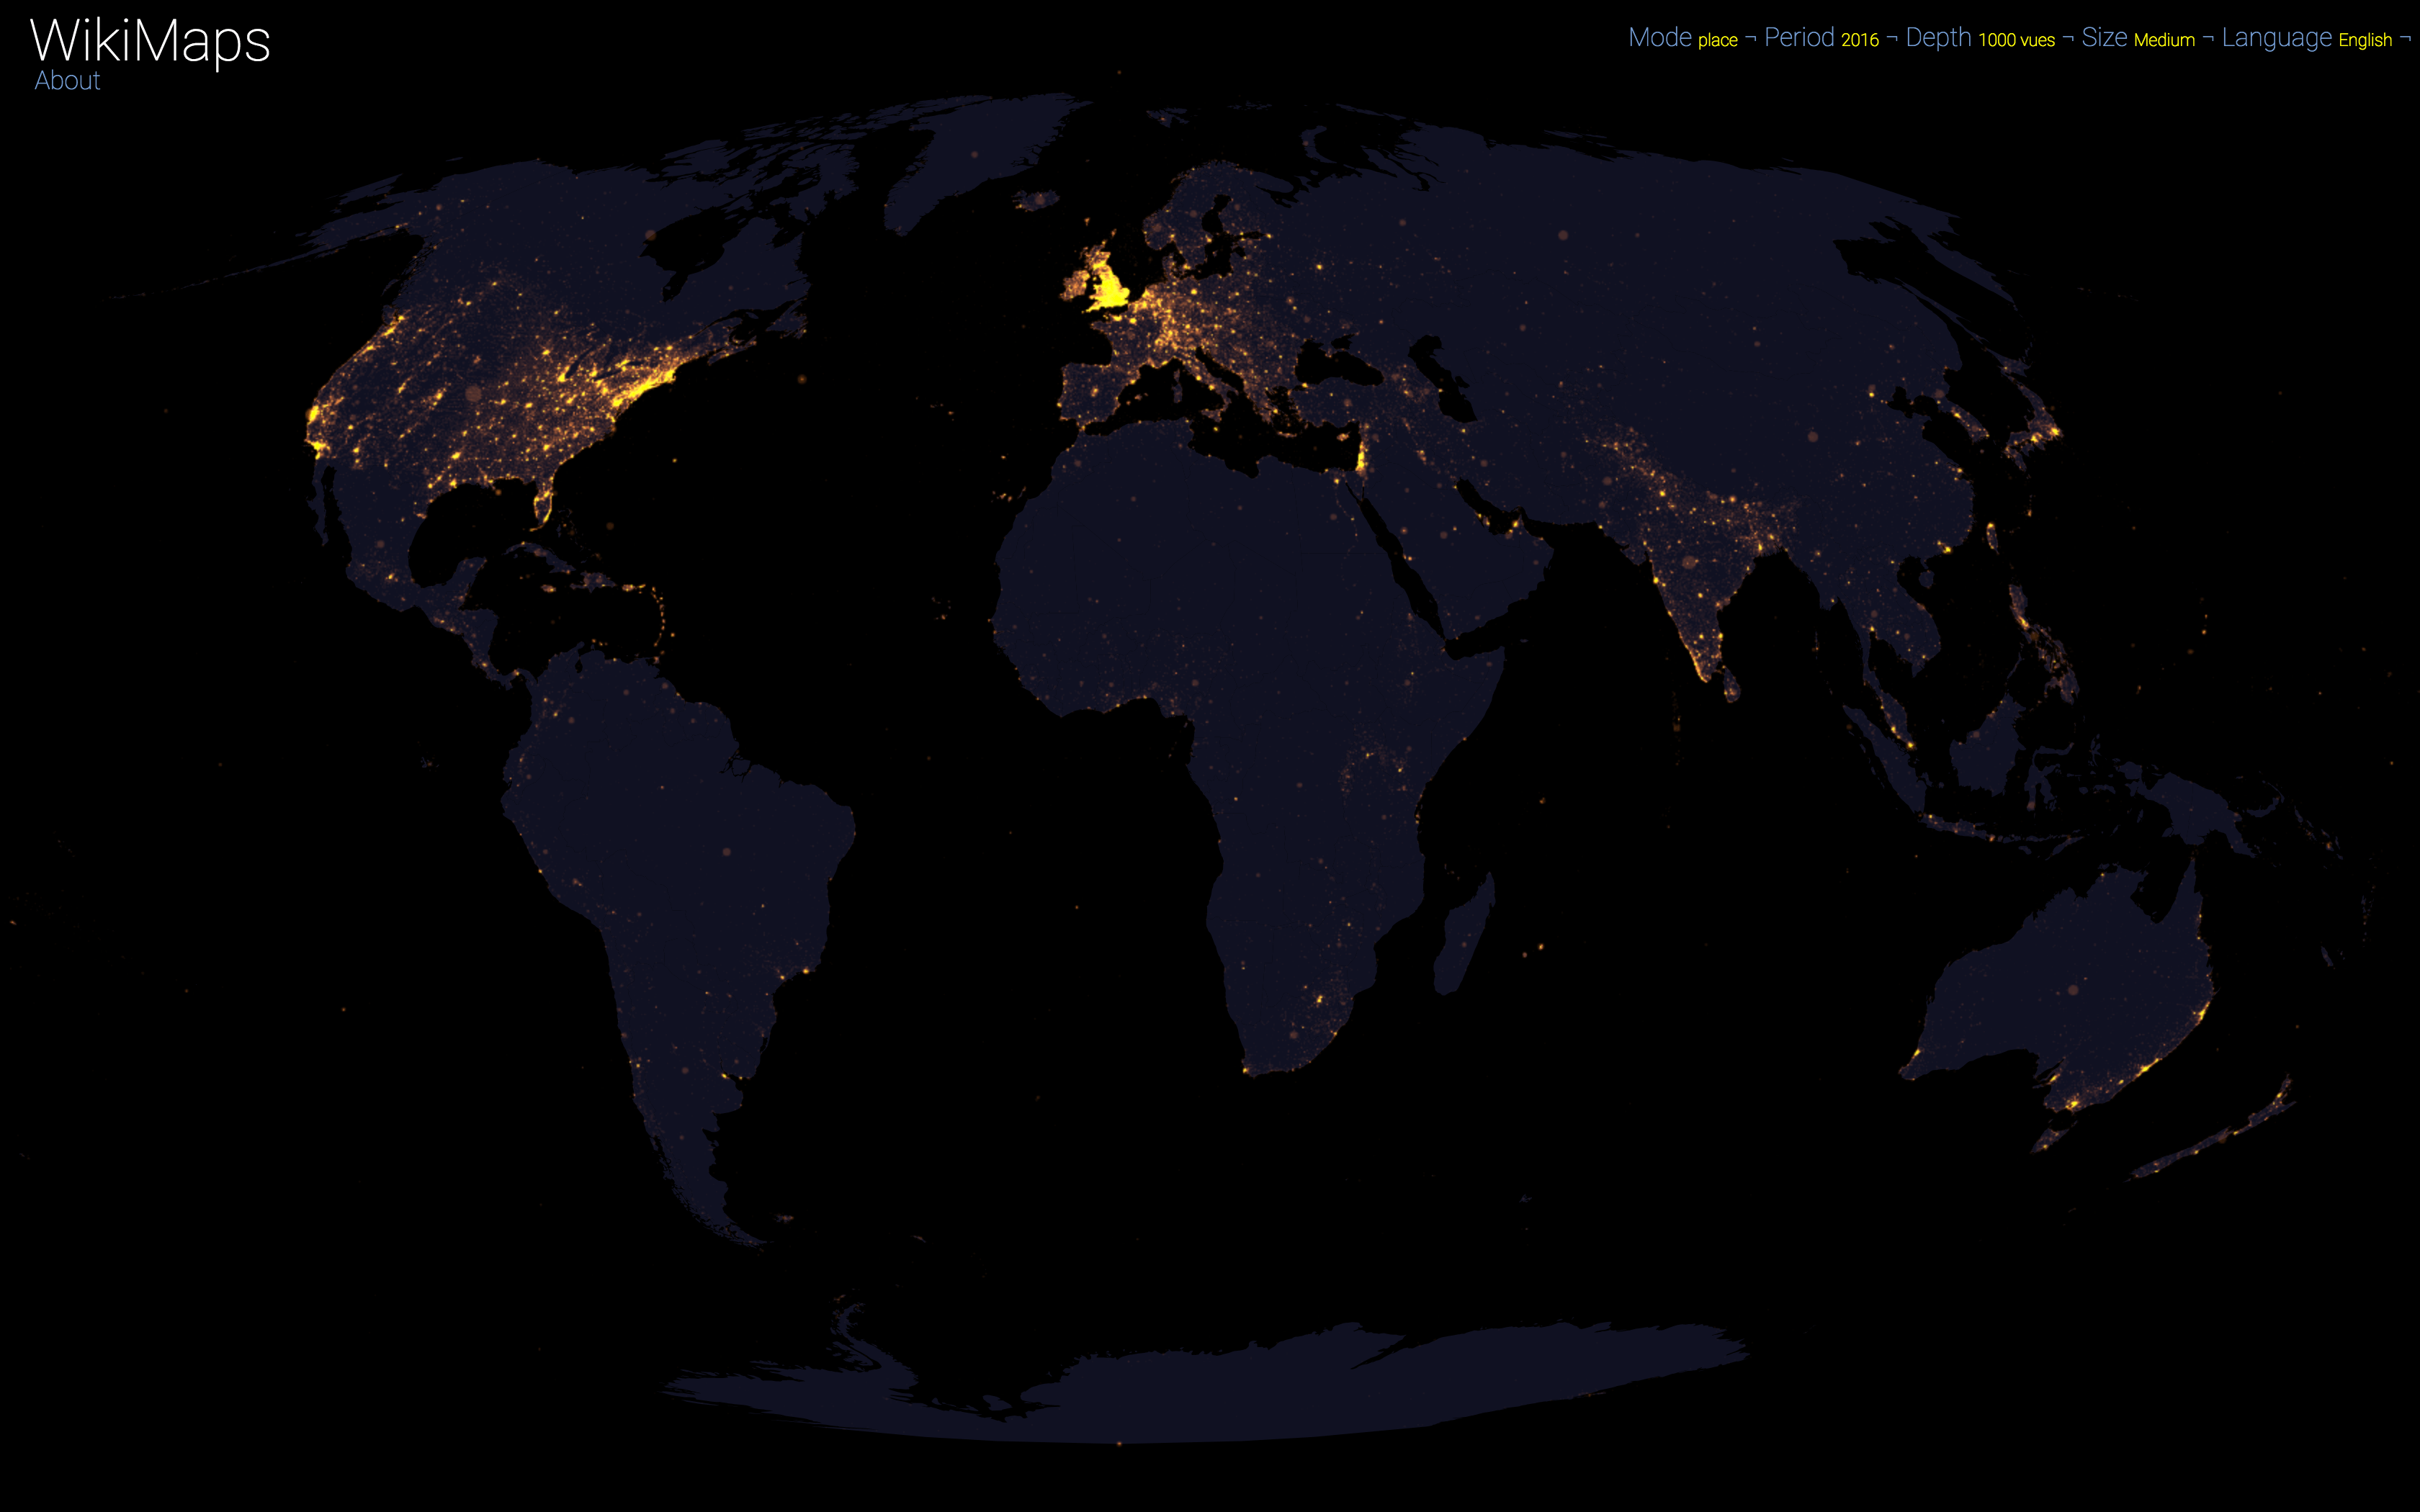
English 2016
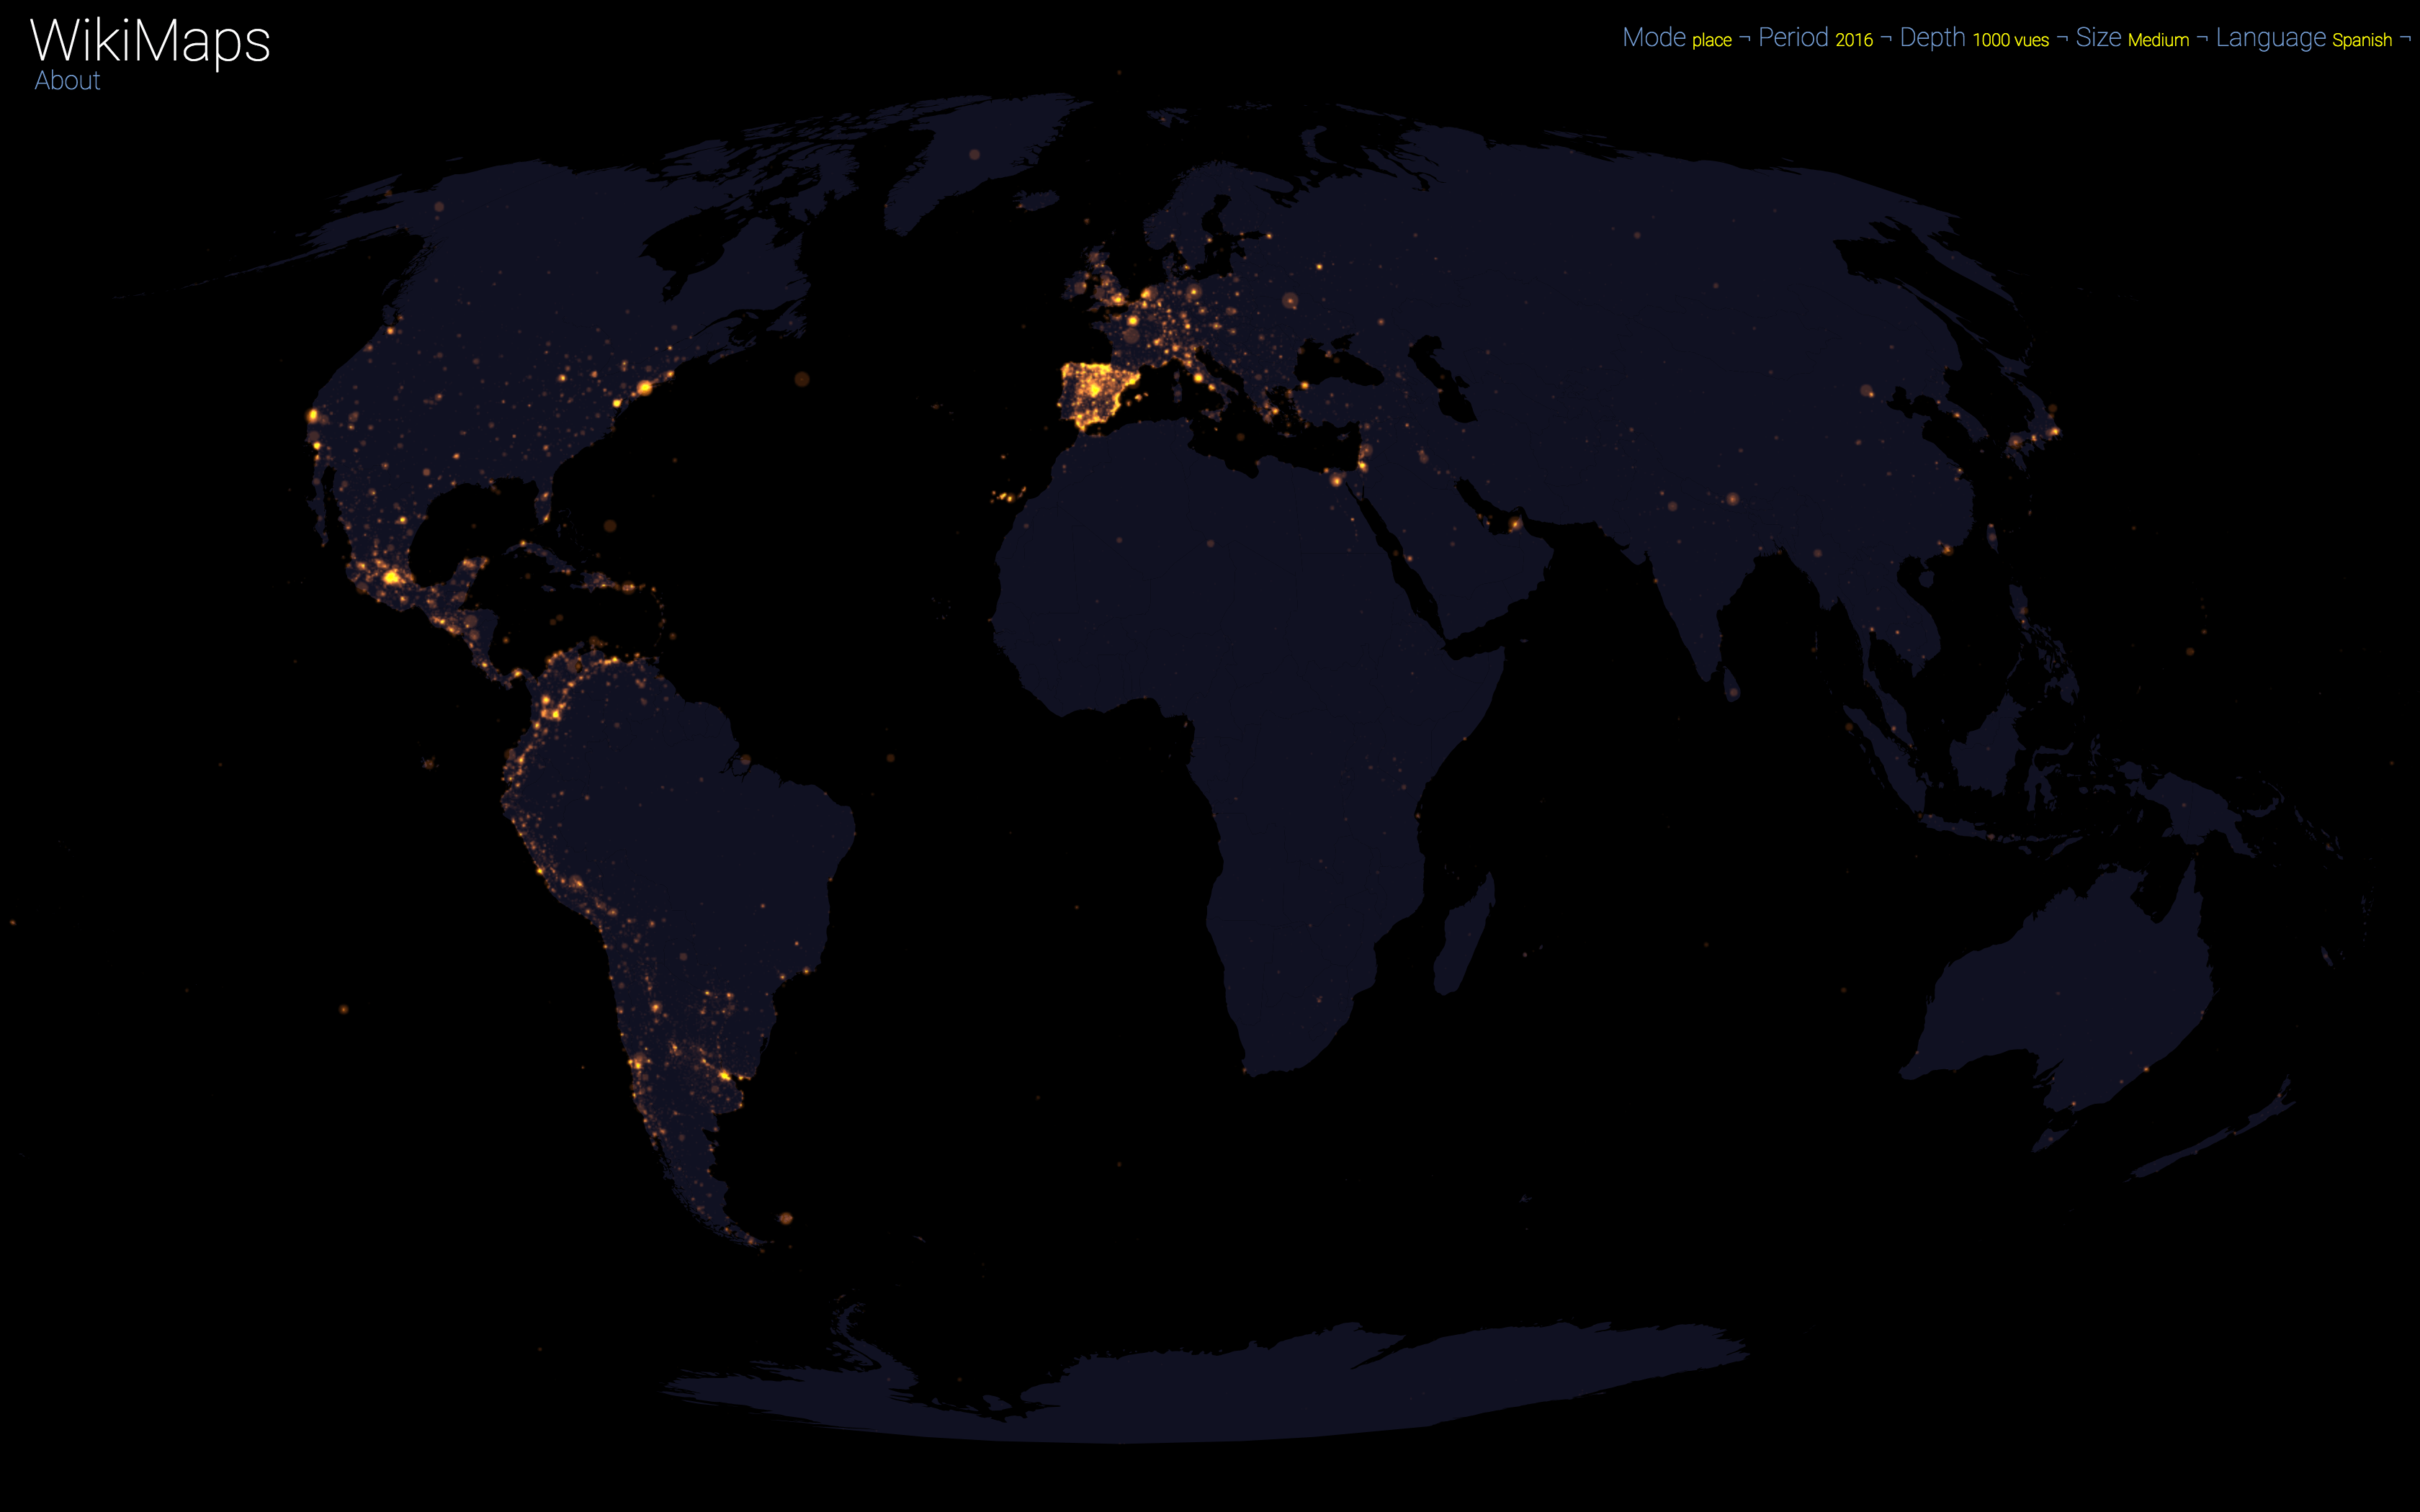
Spanish 2016
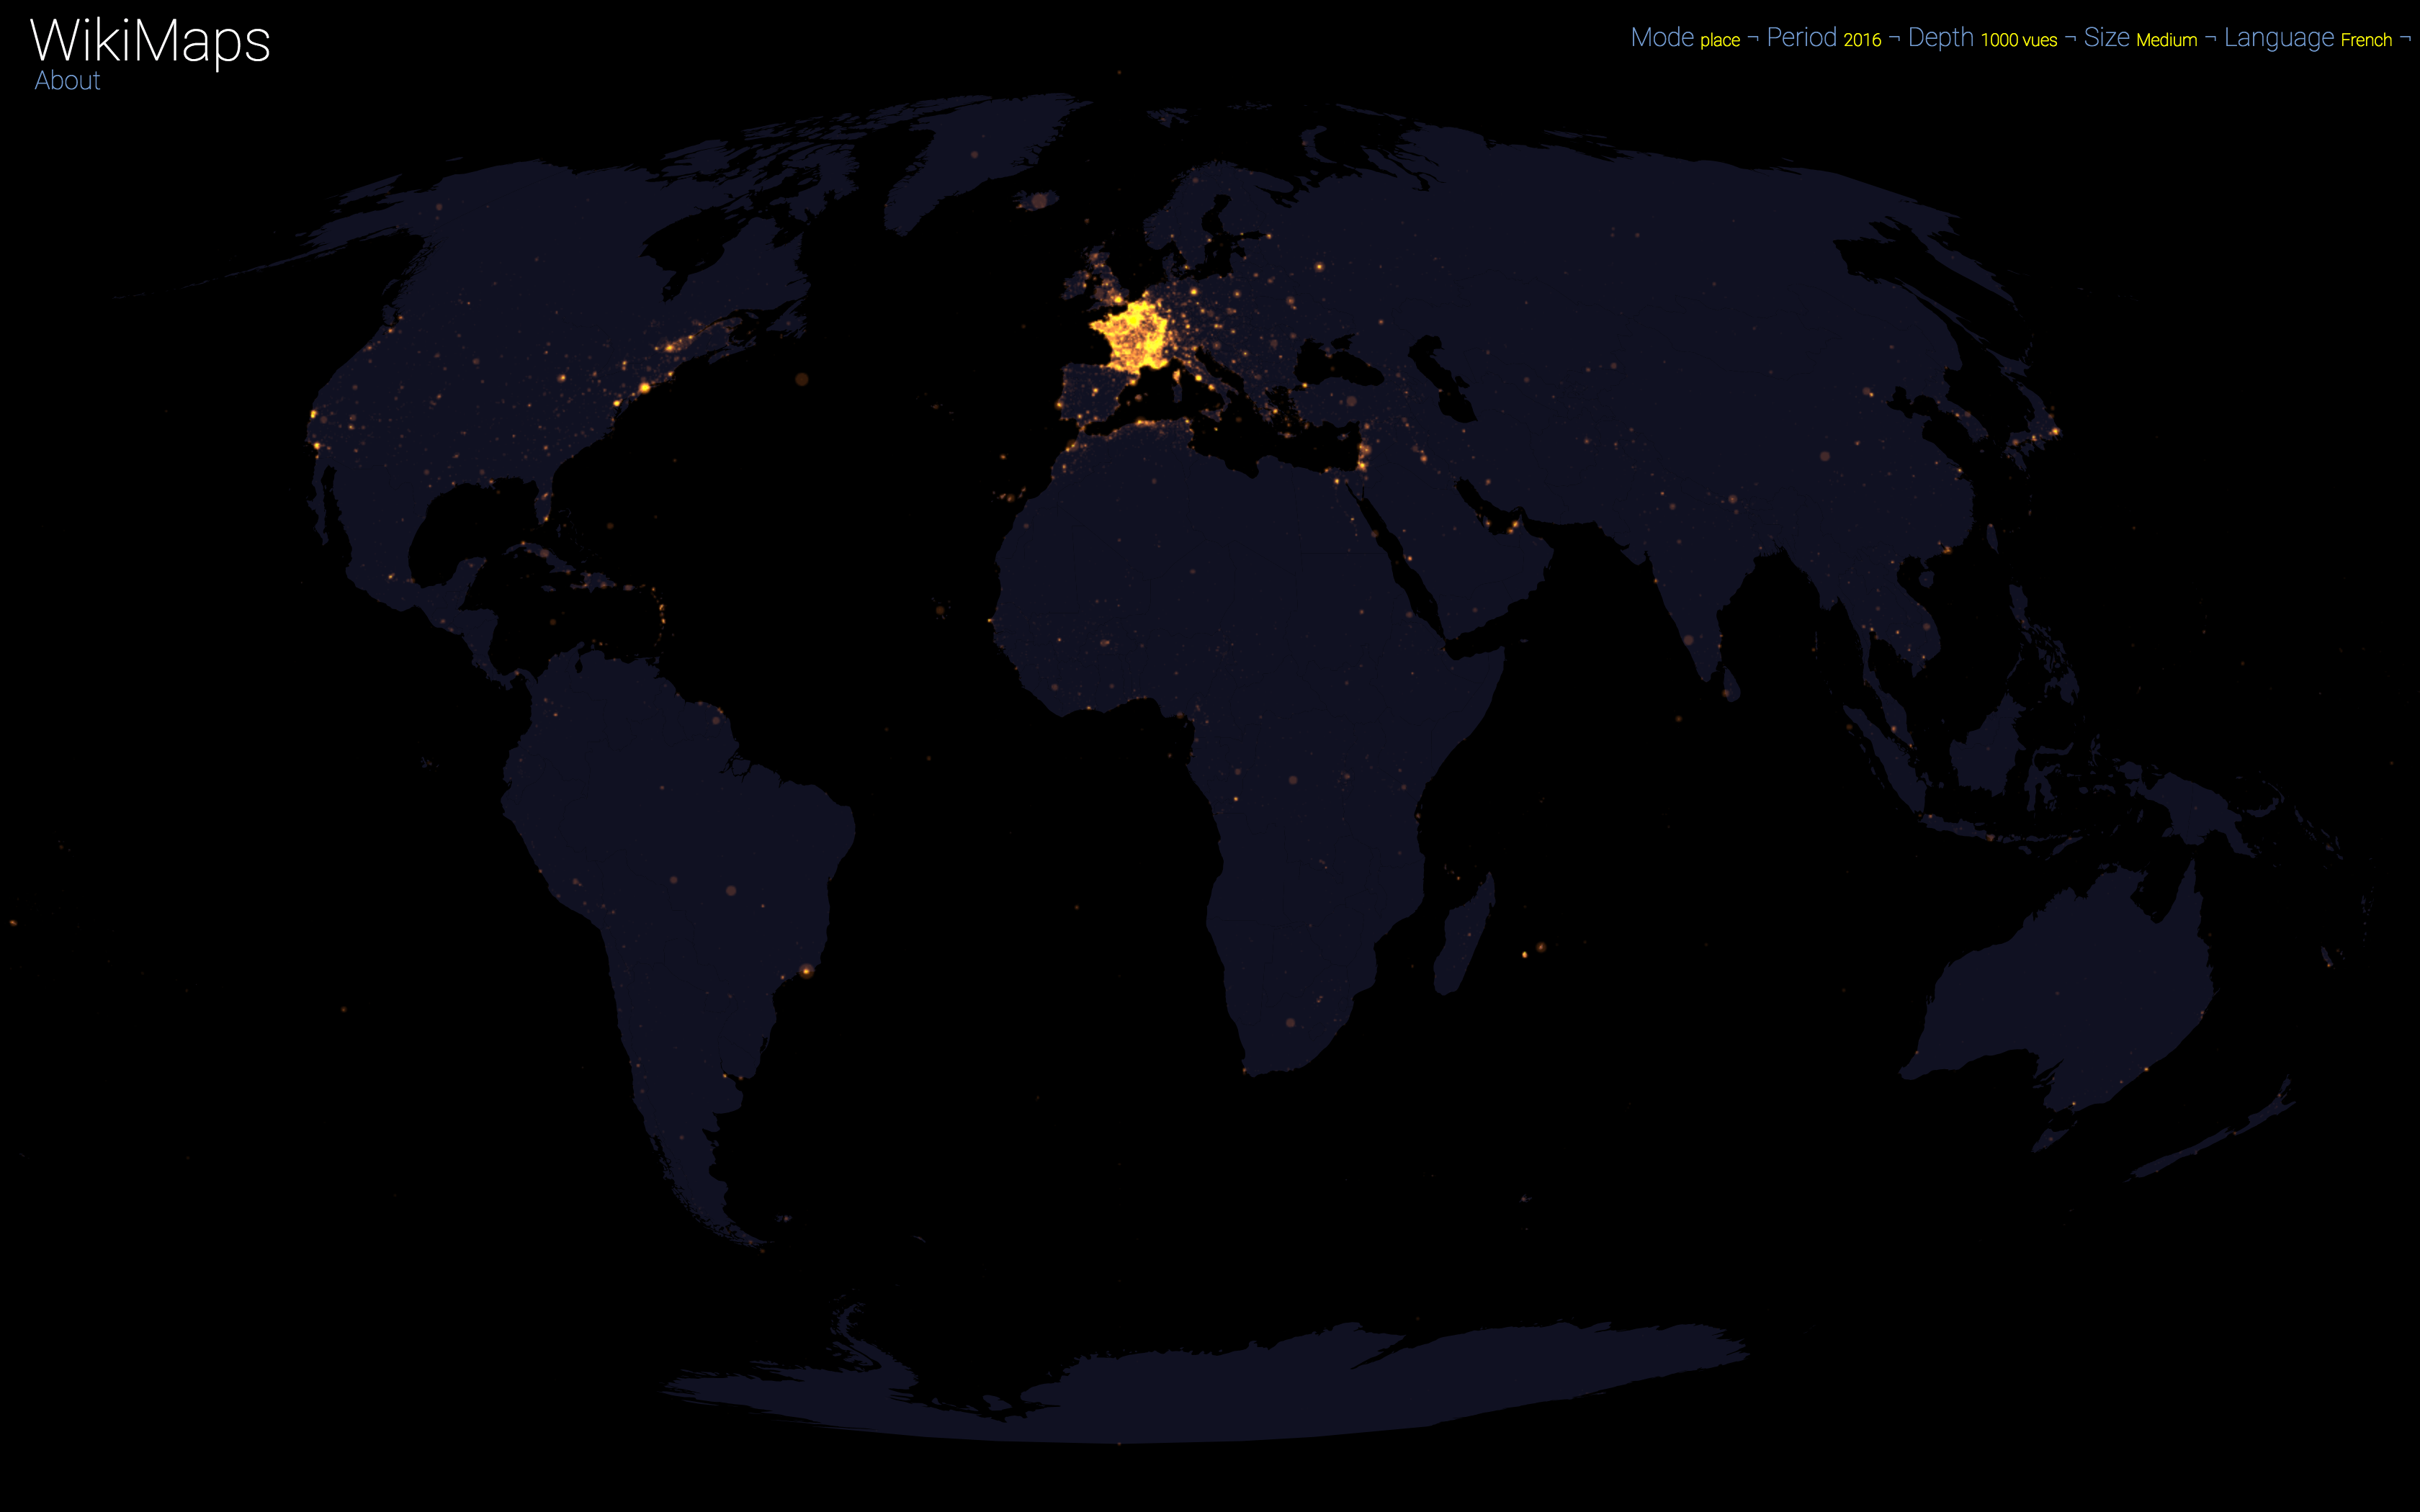
French 2016
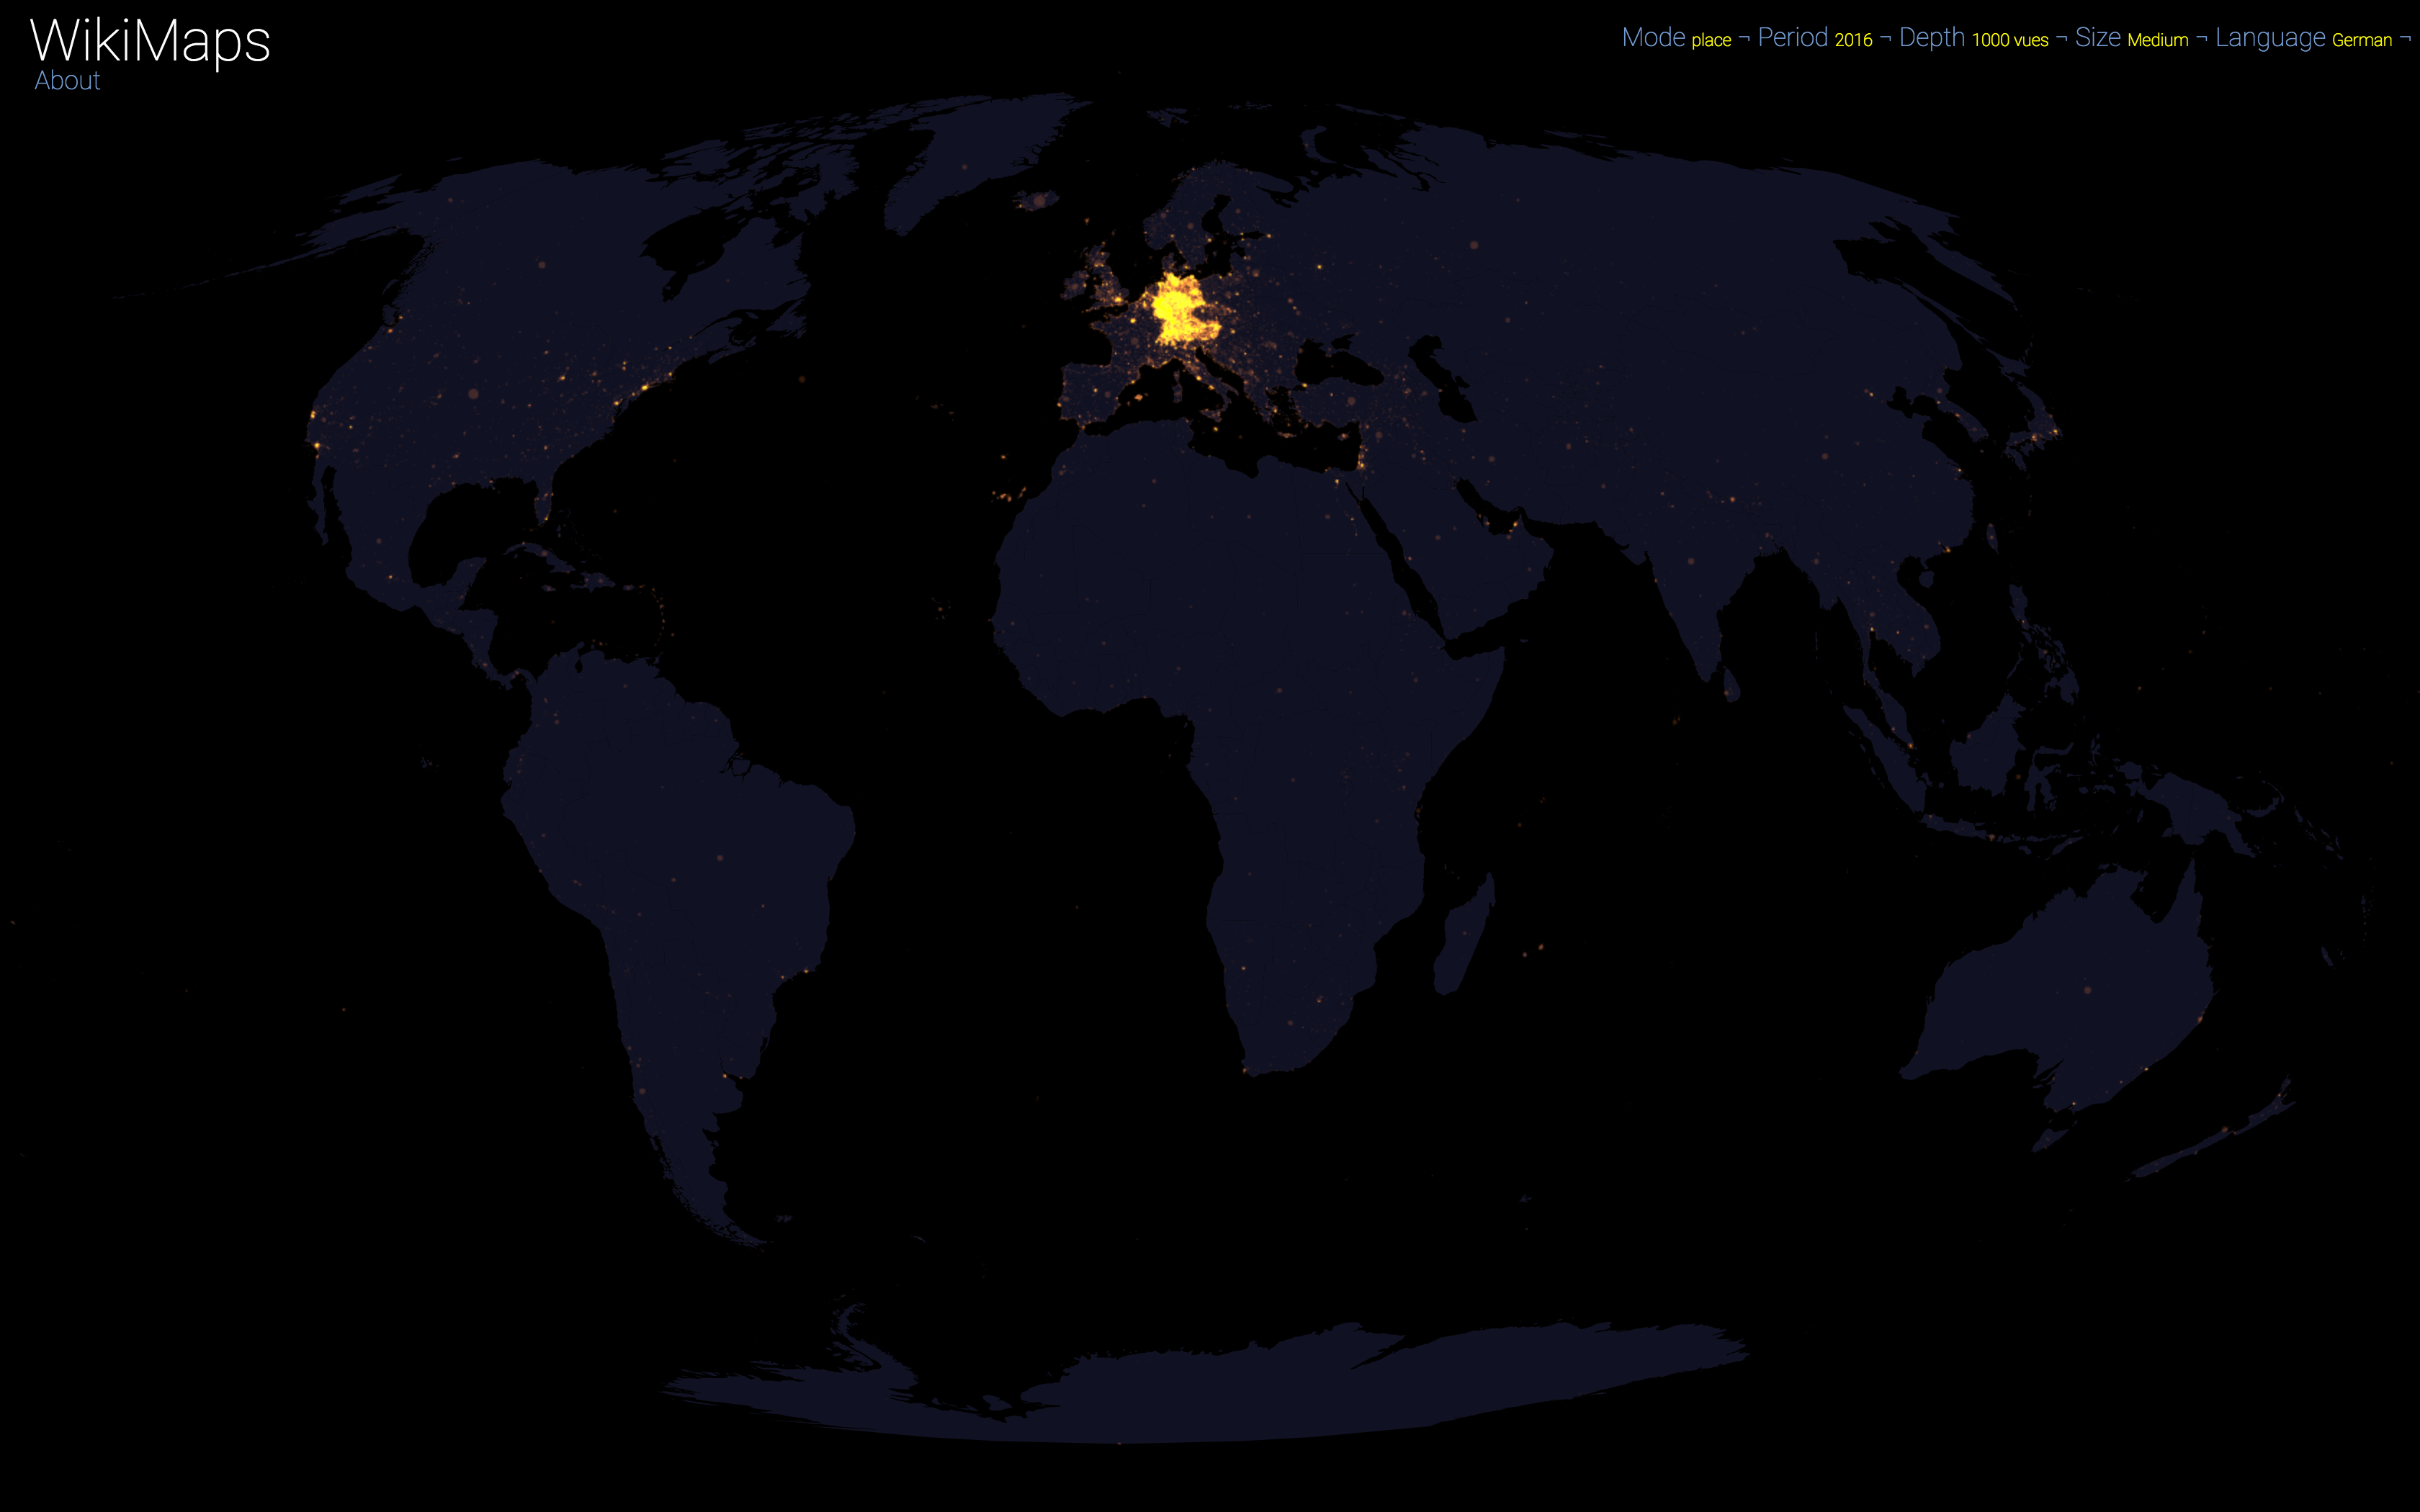
German 2016
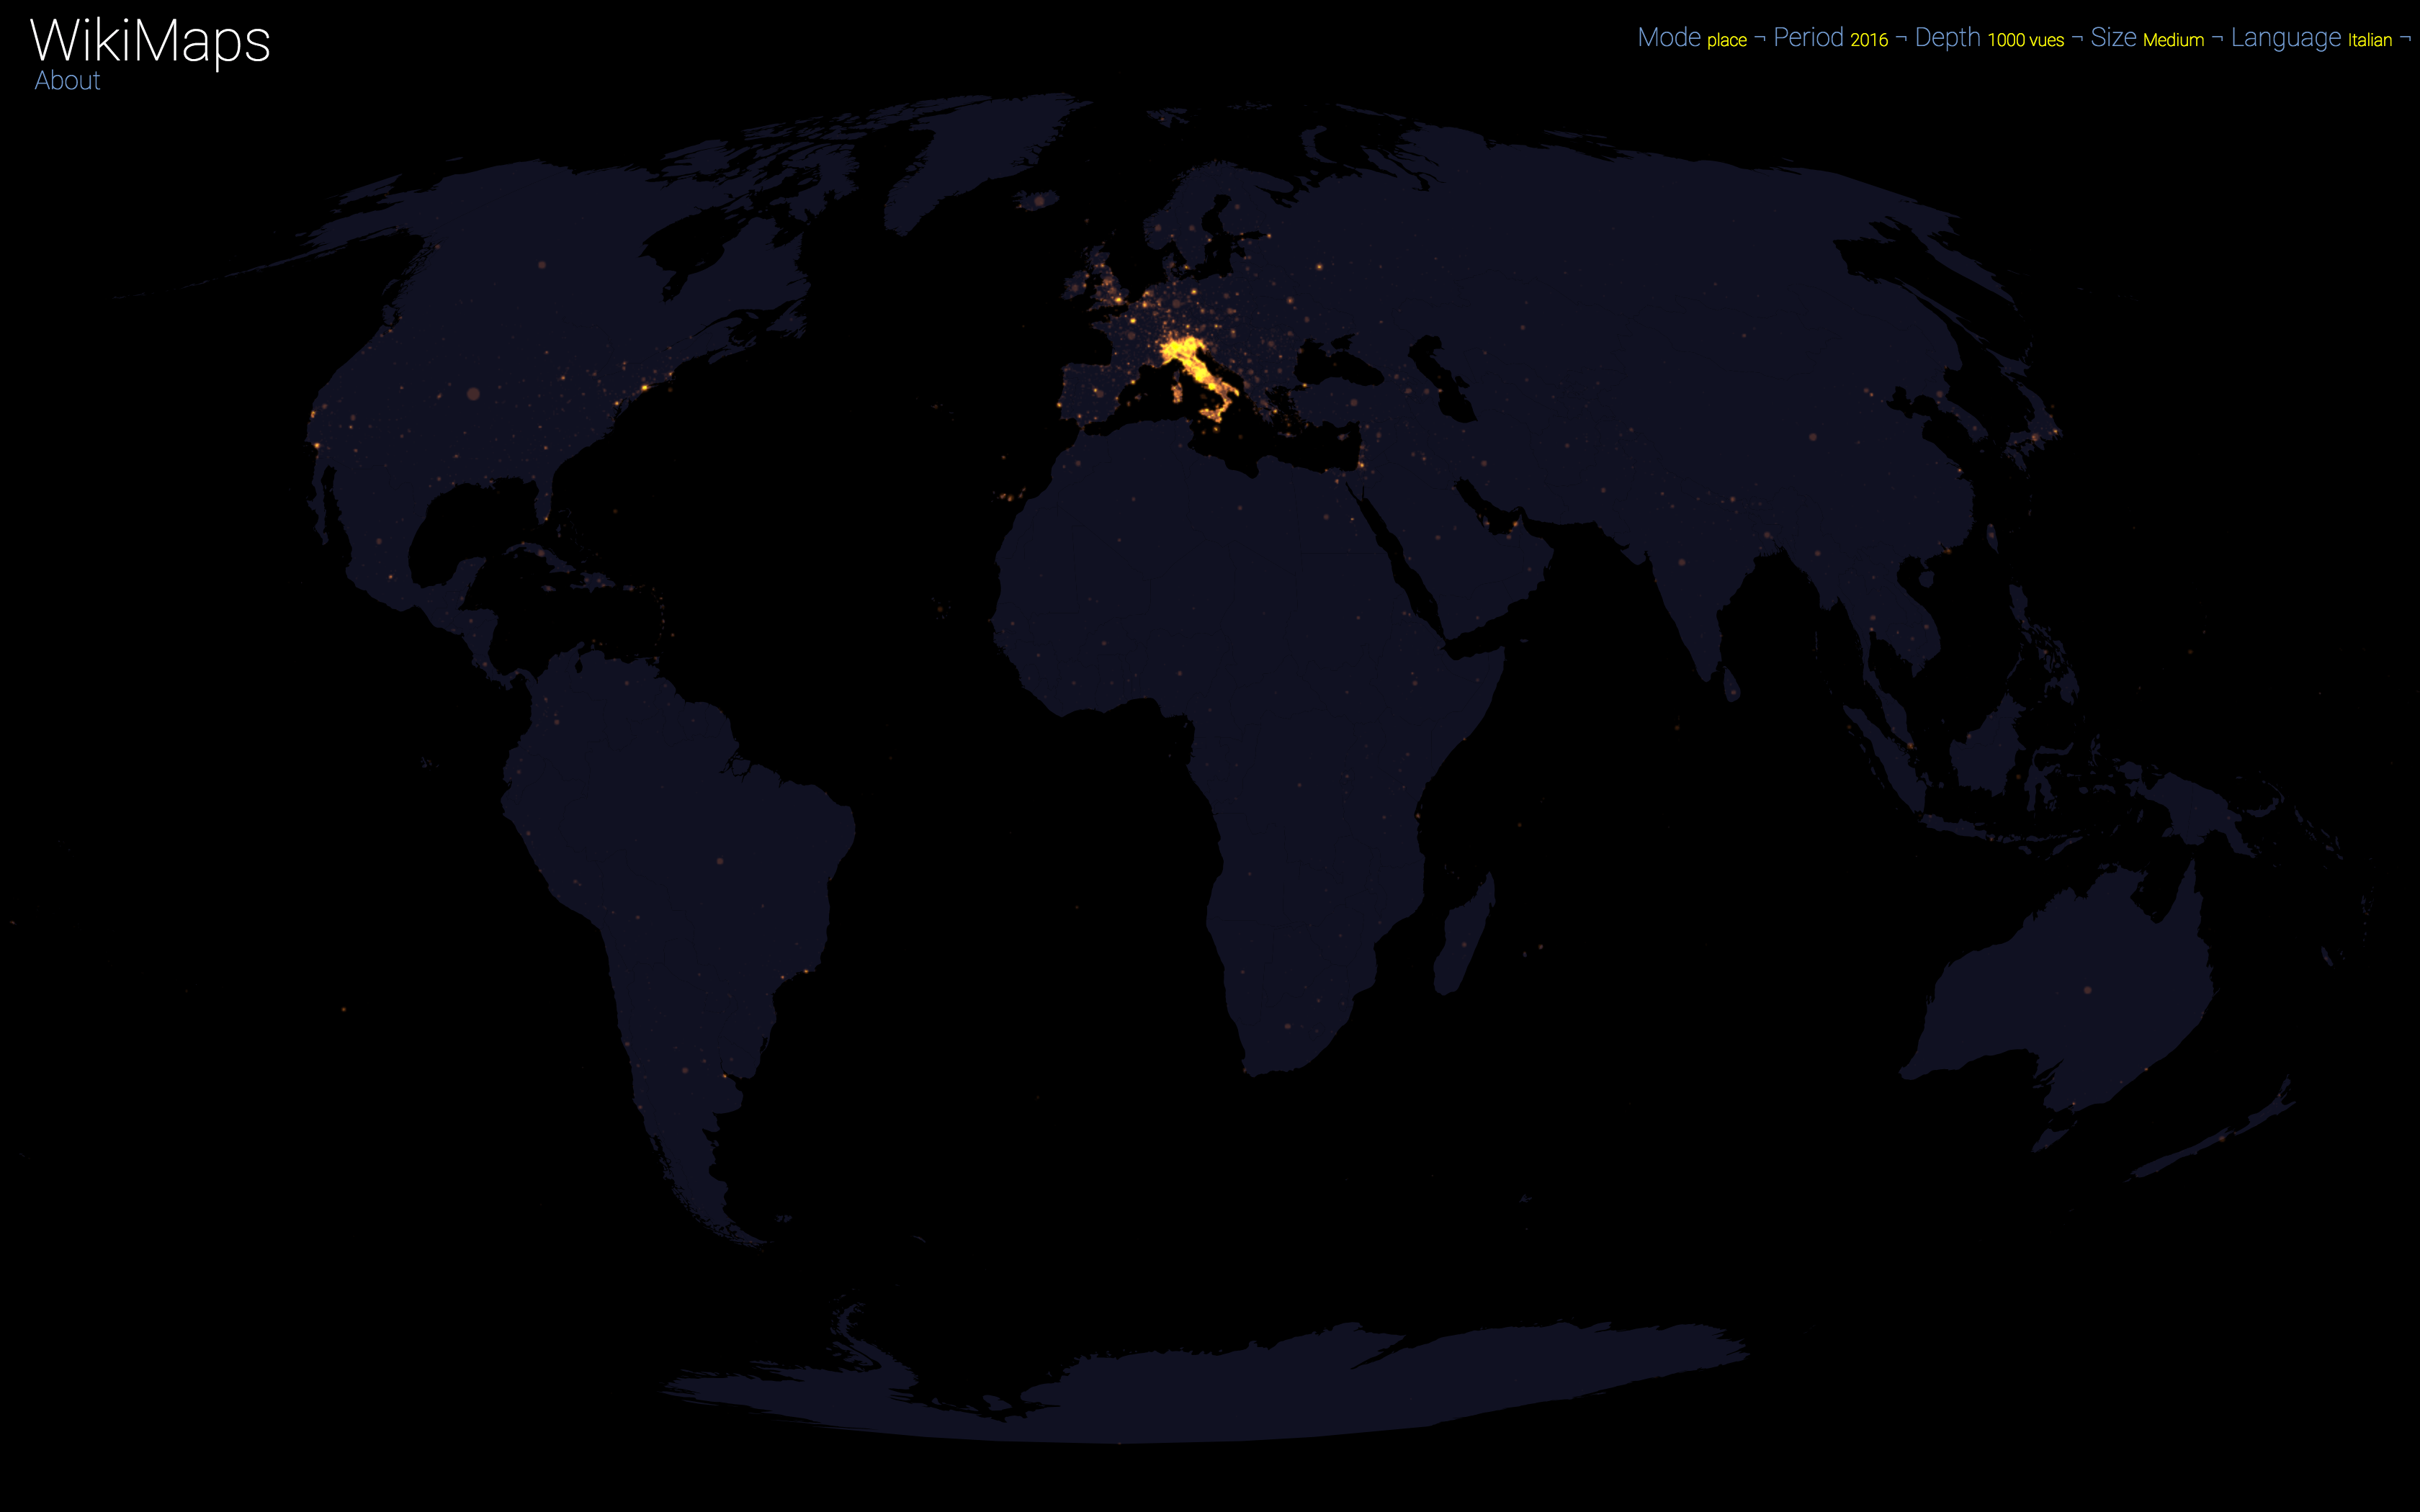
Italian 2016
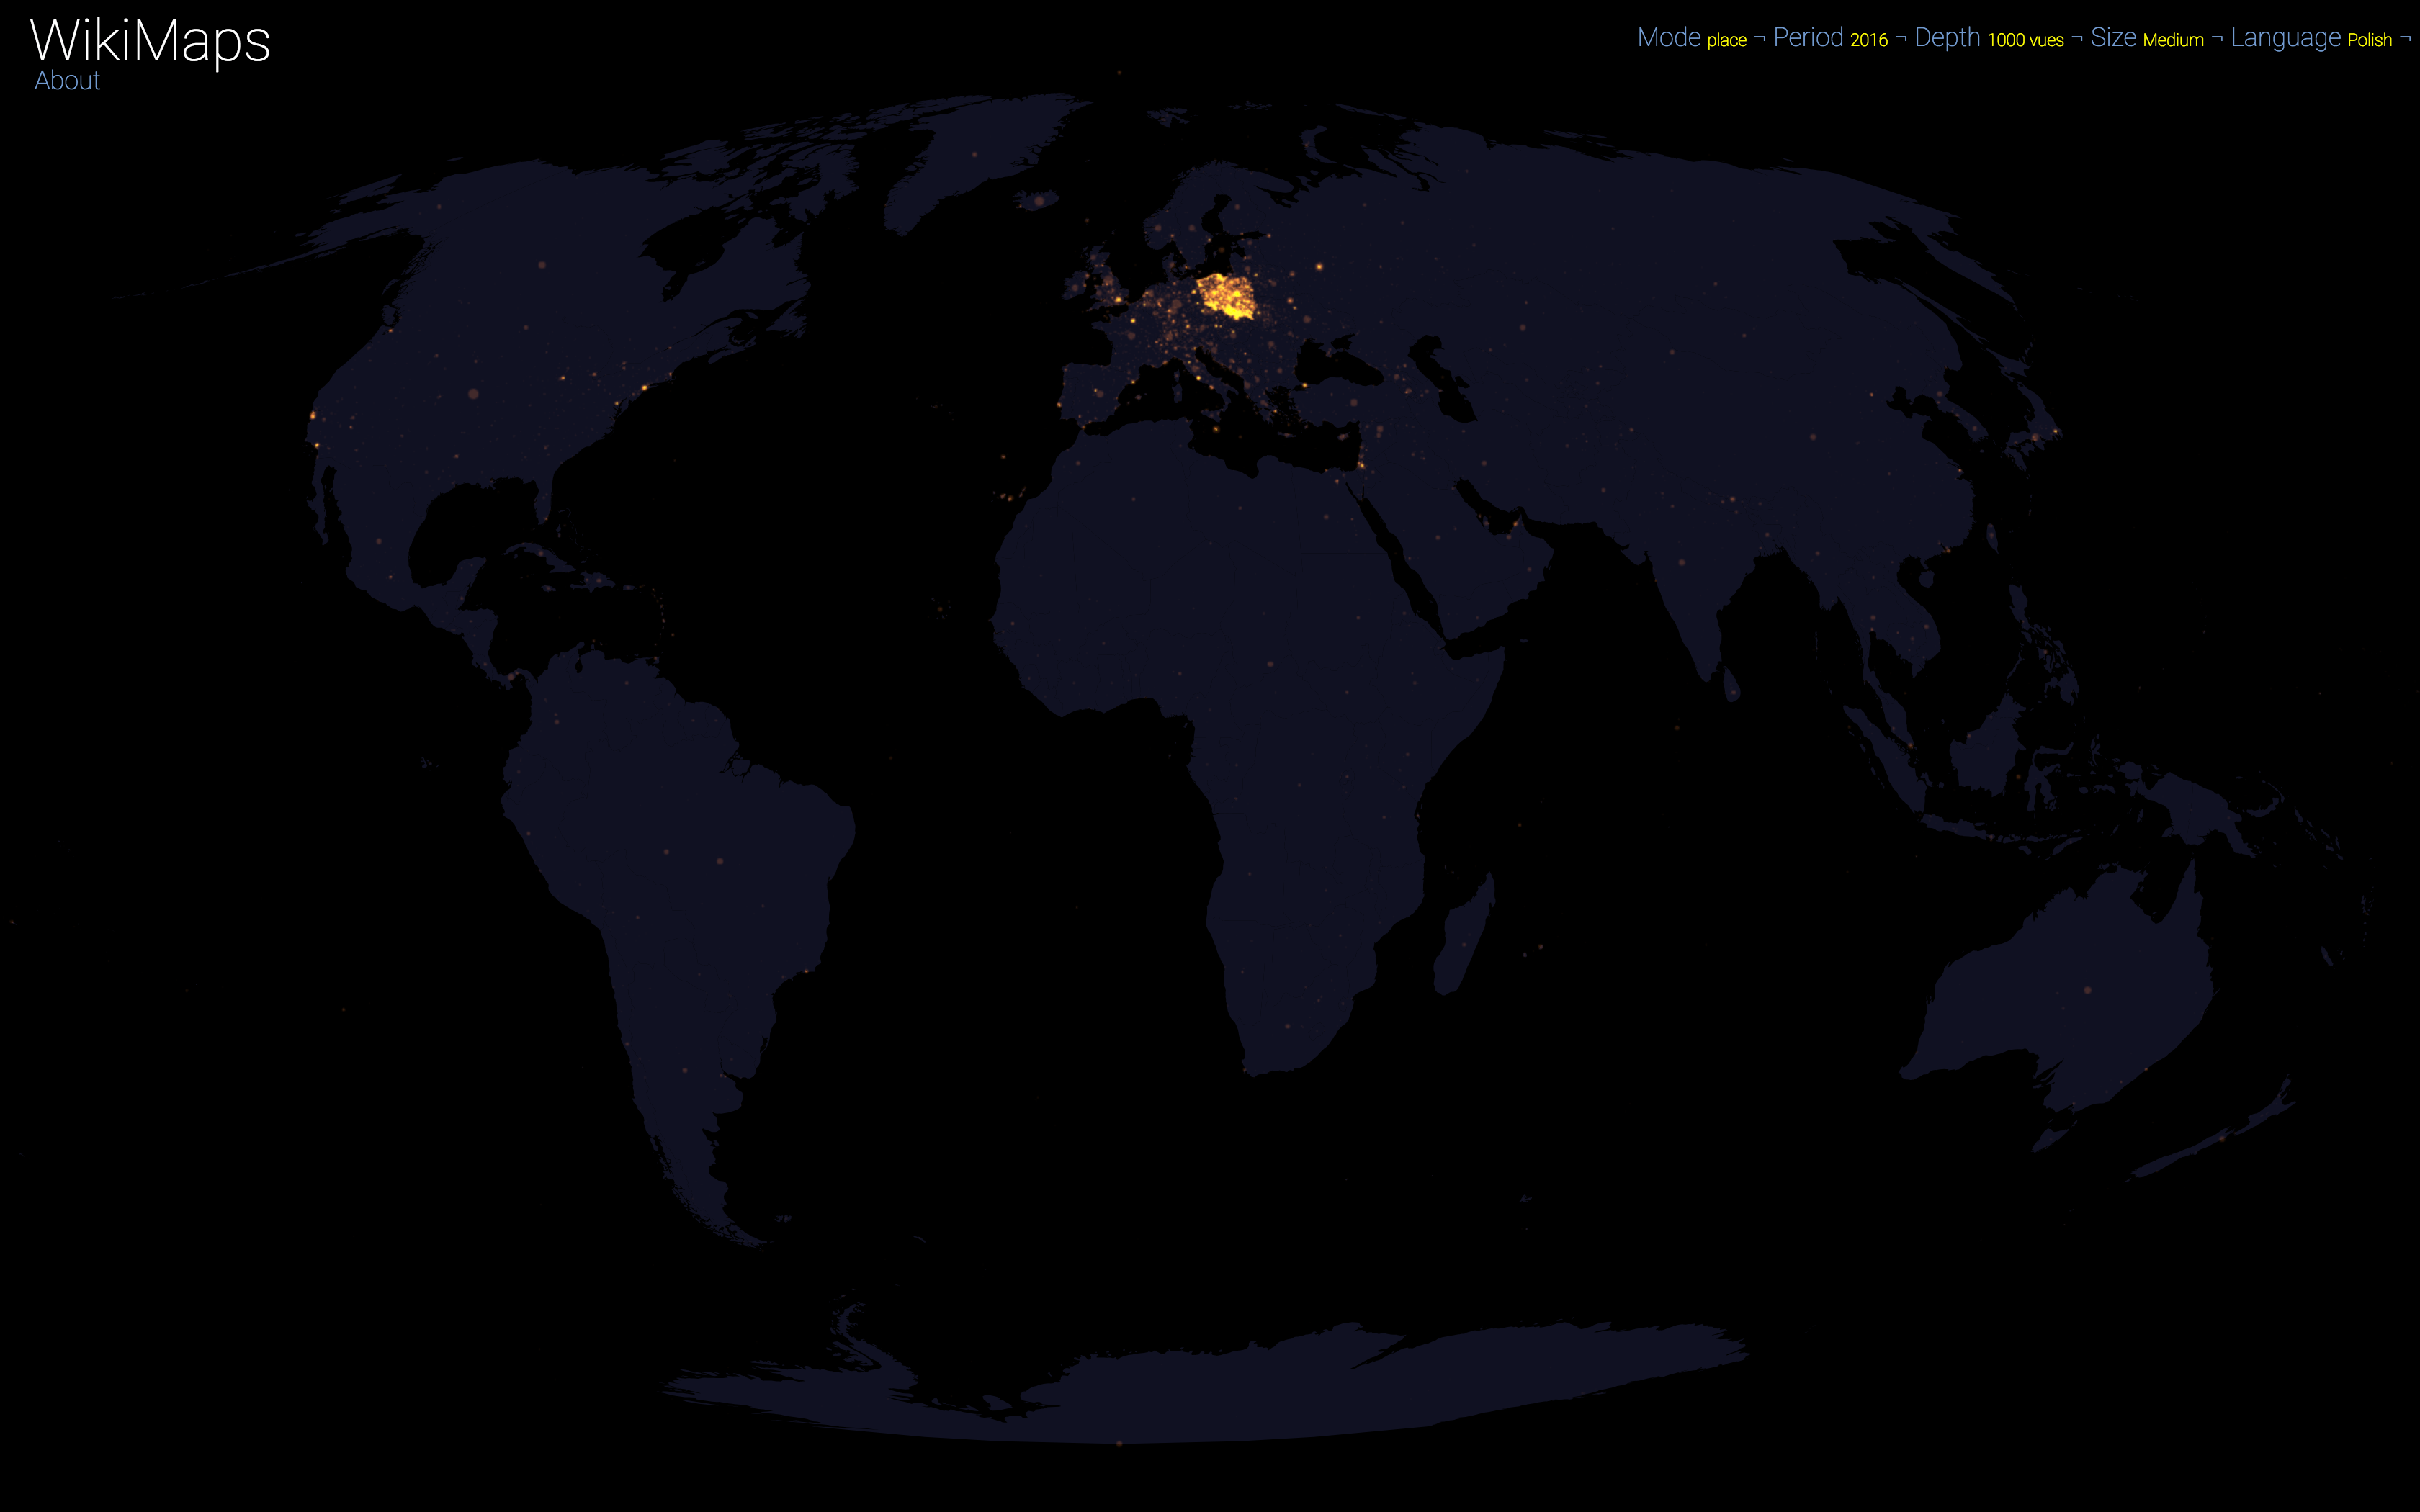
Polish 2016
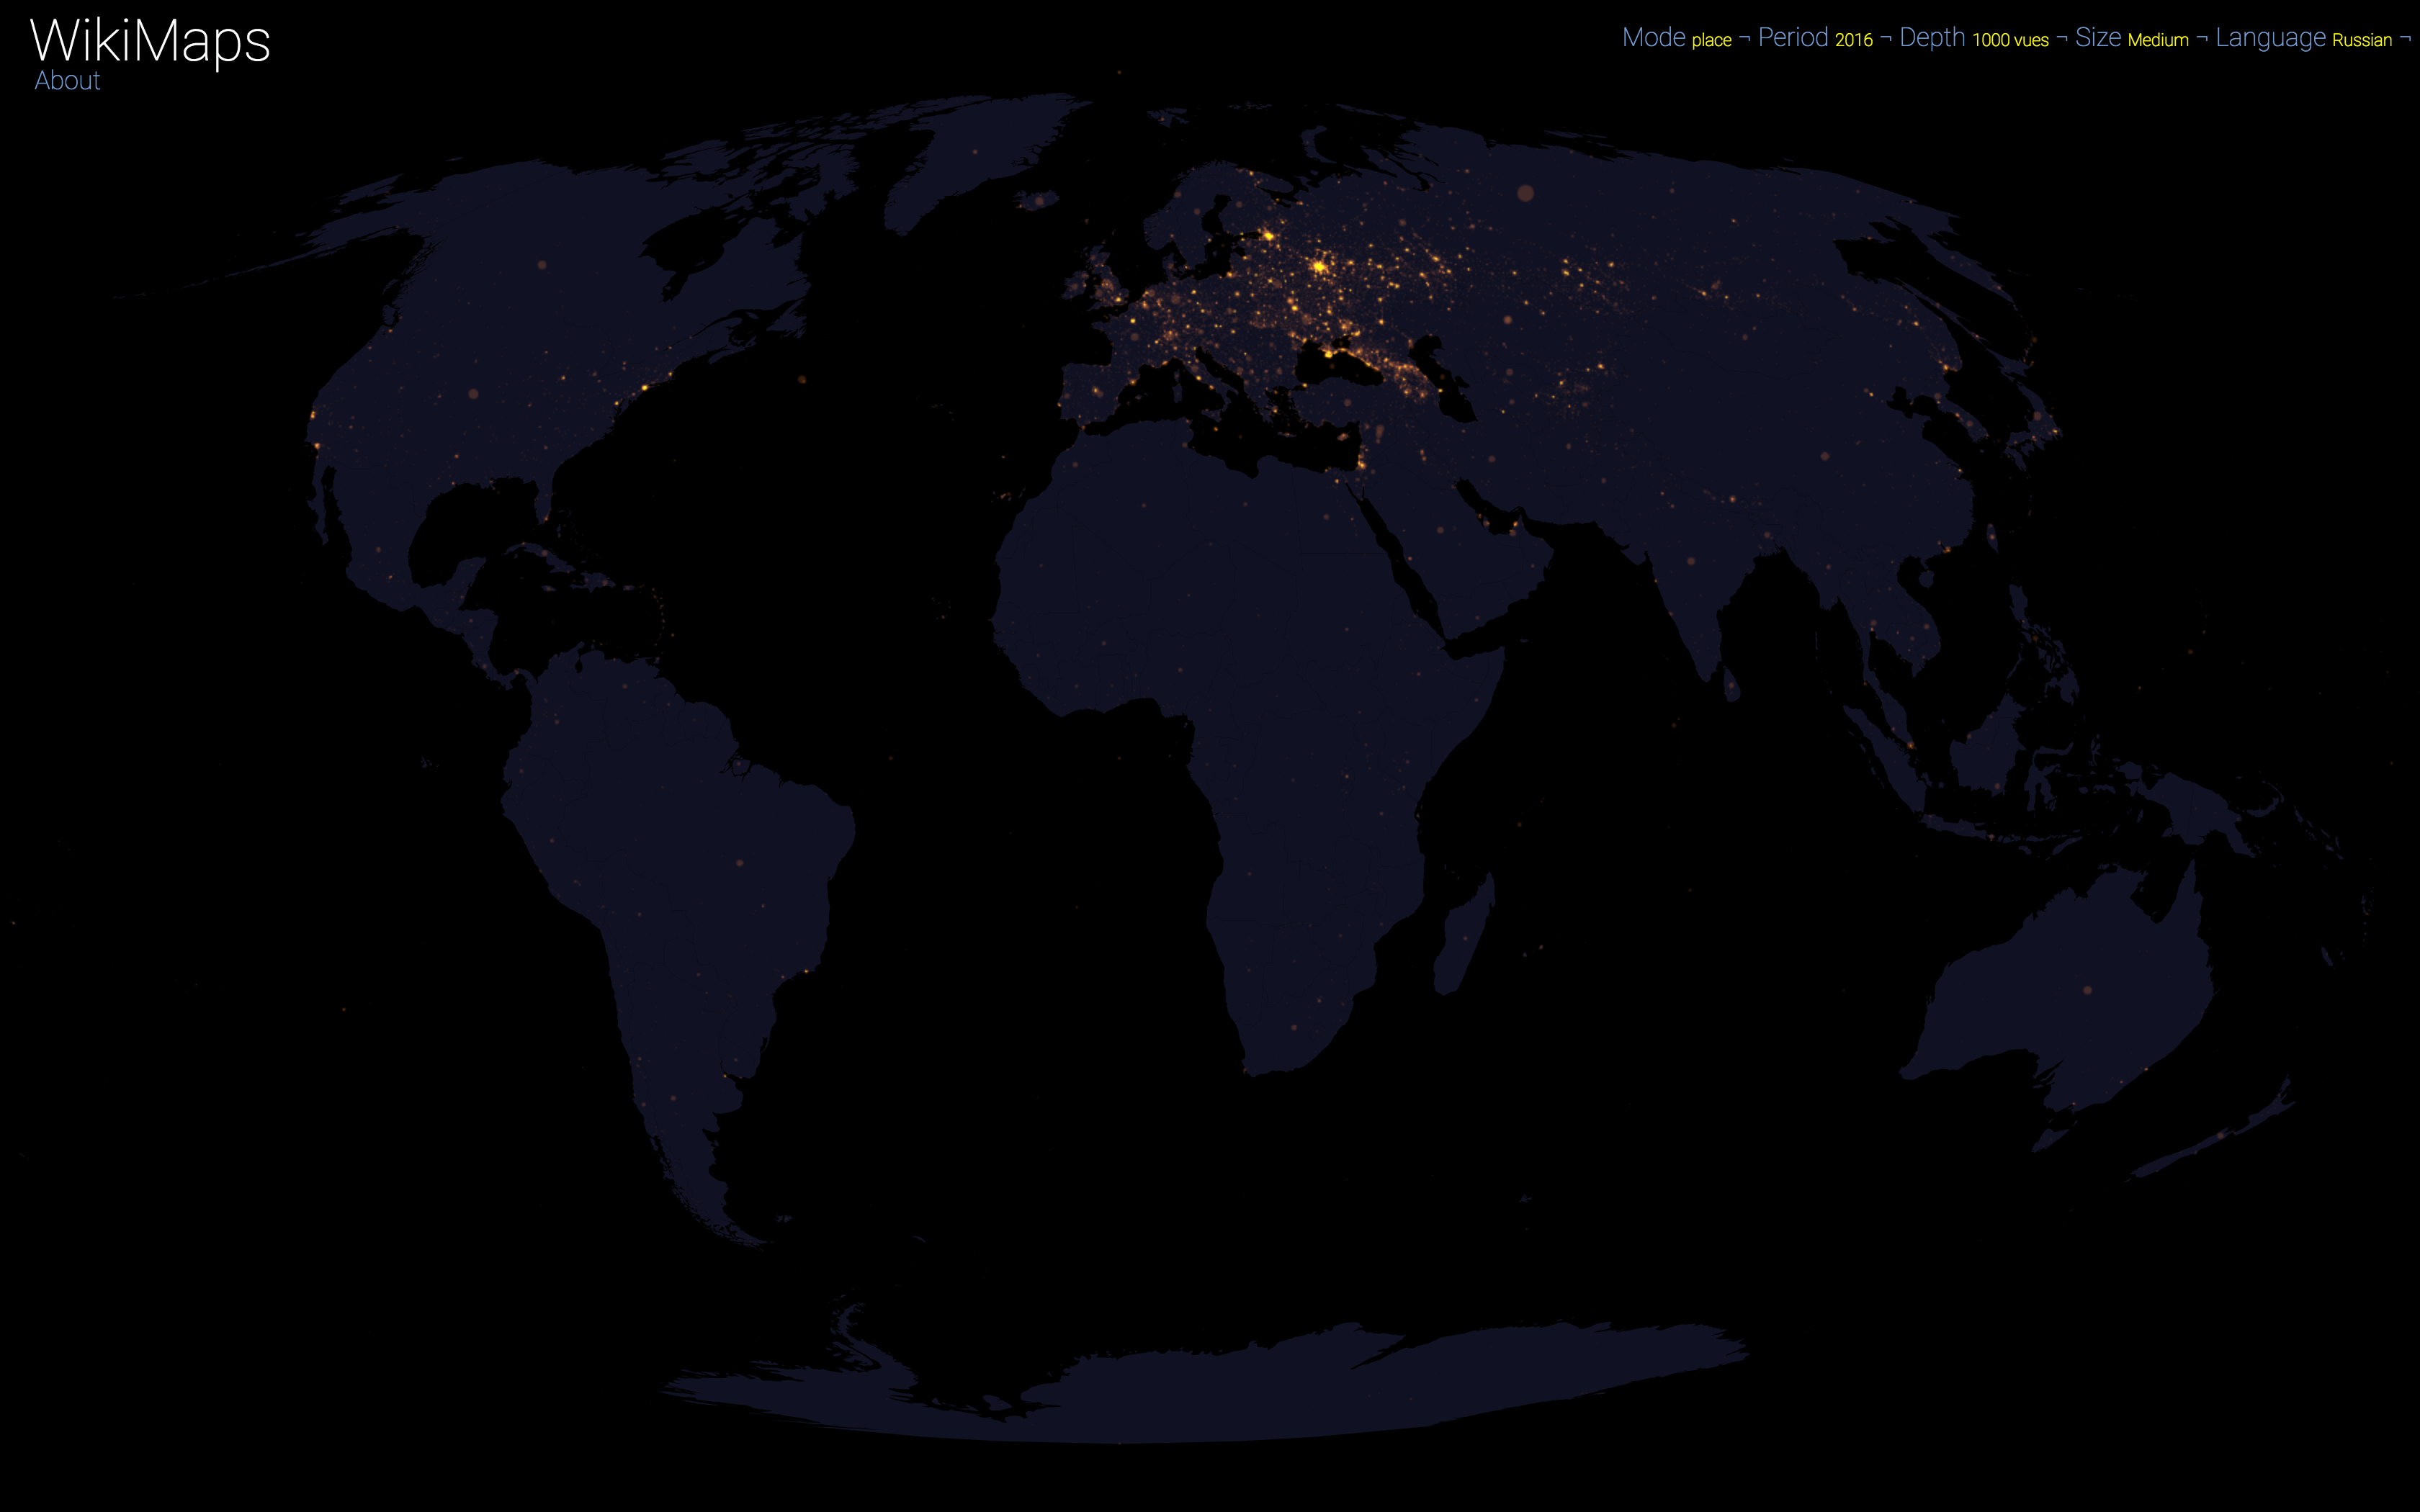
Russian 2016
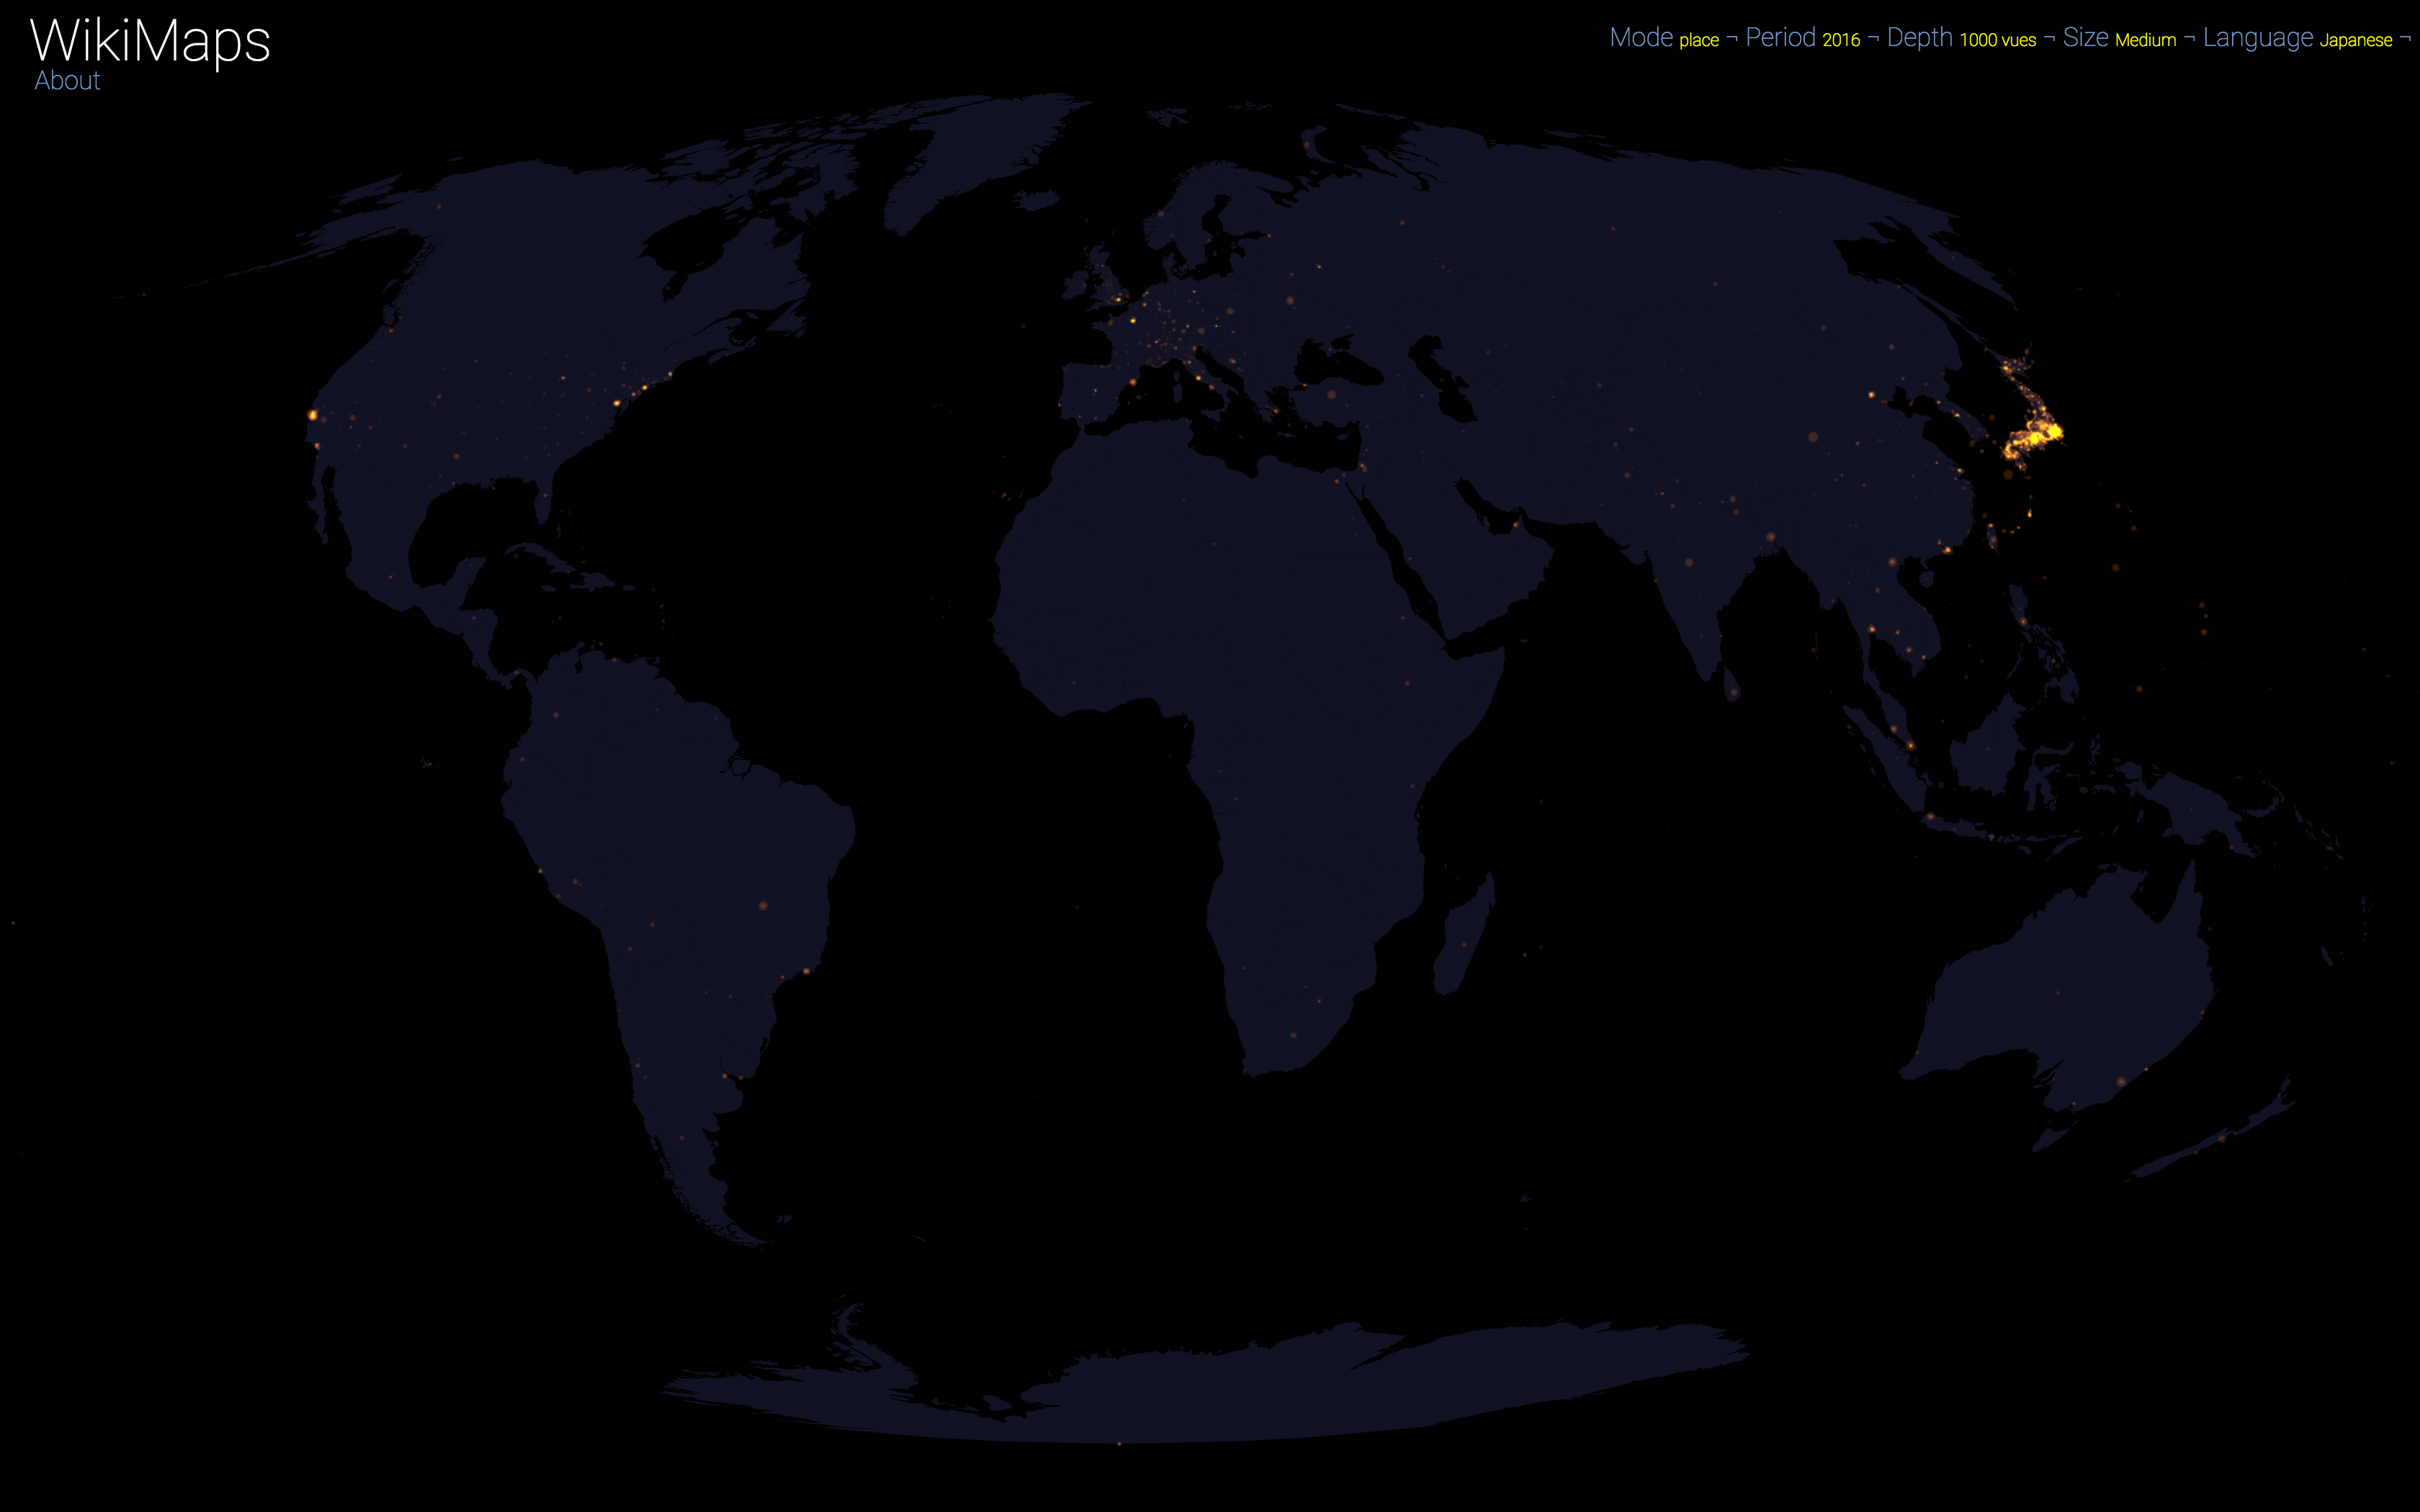
Japanese 2016
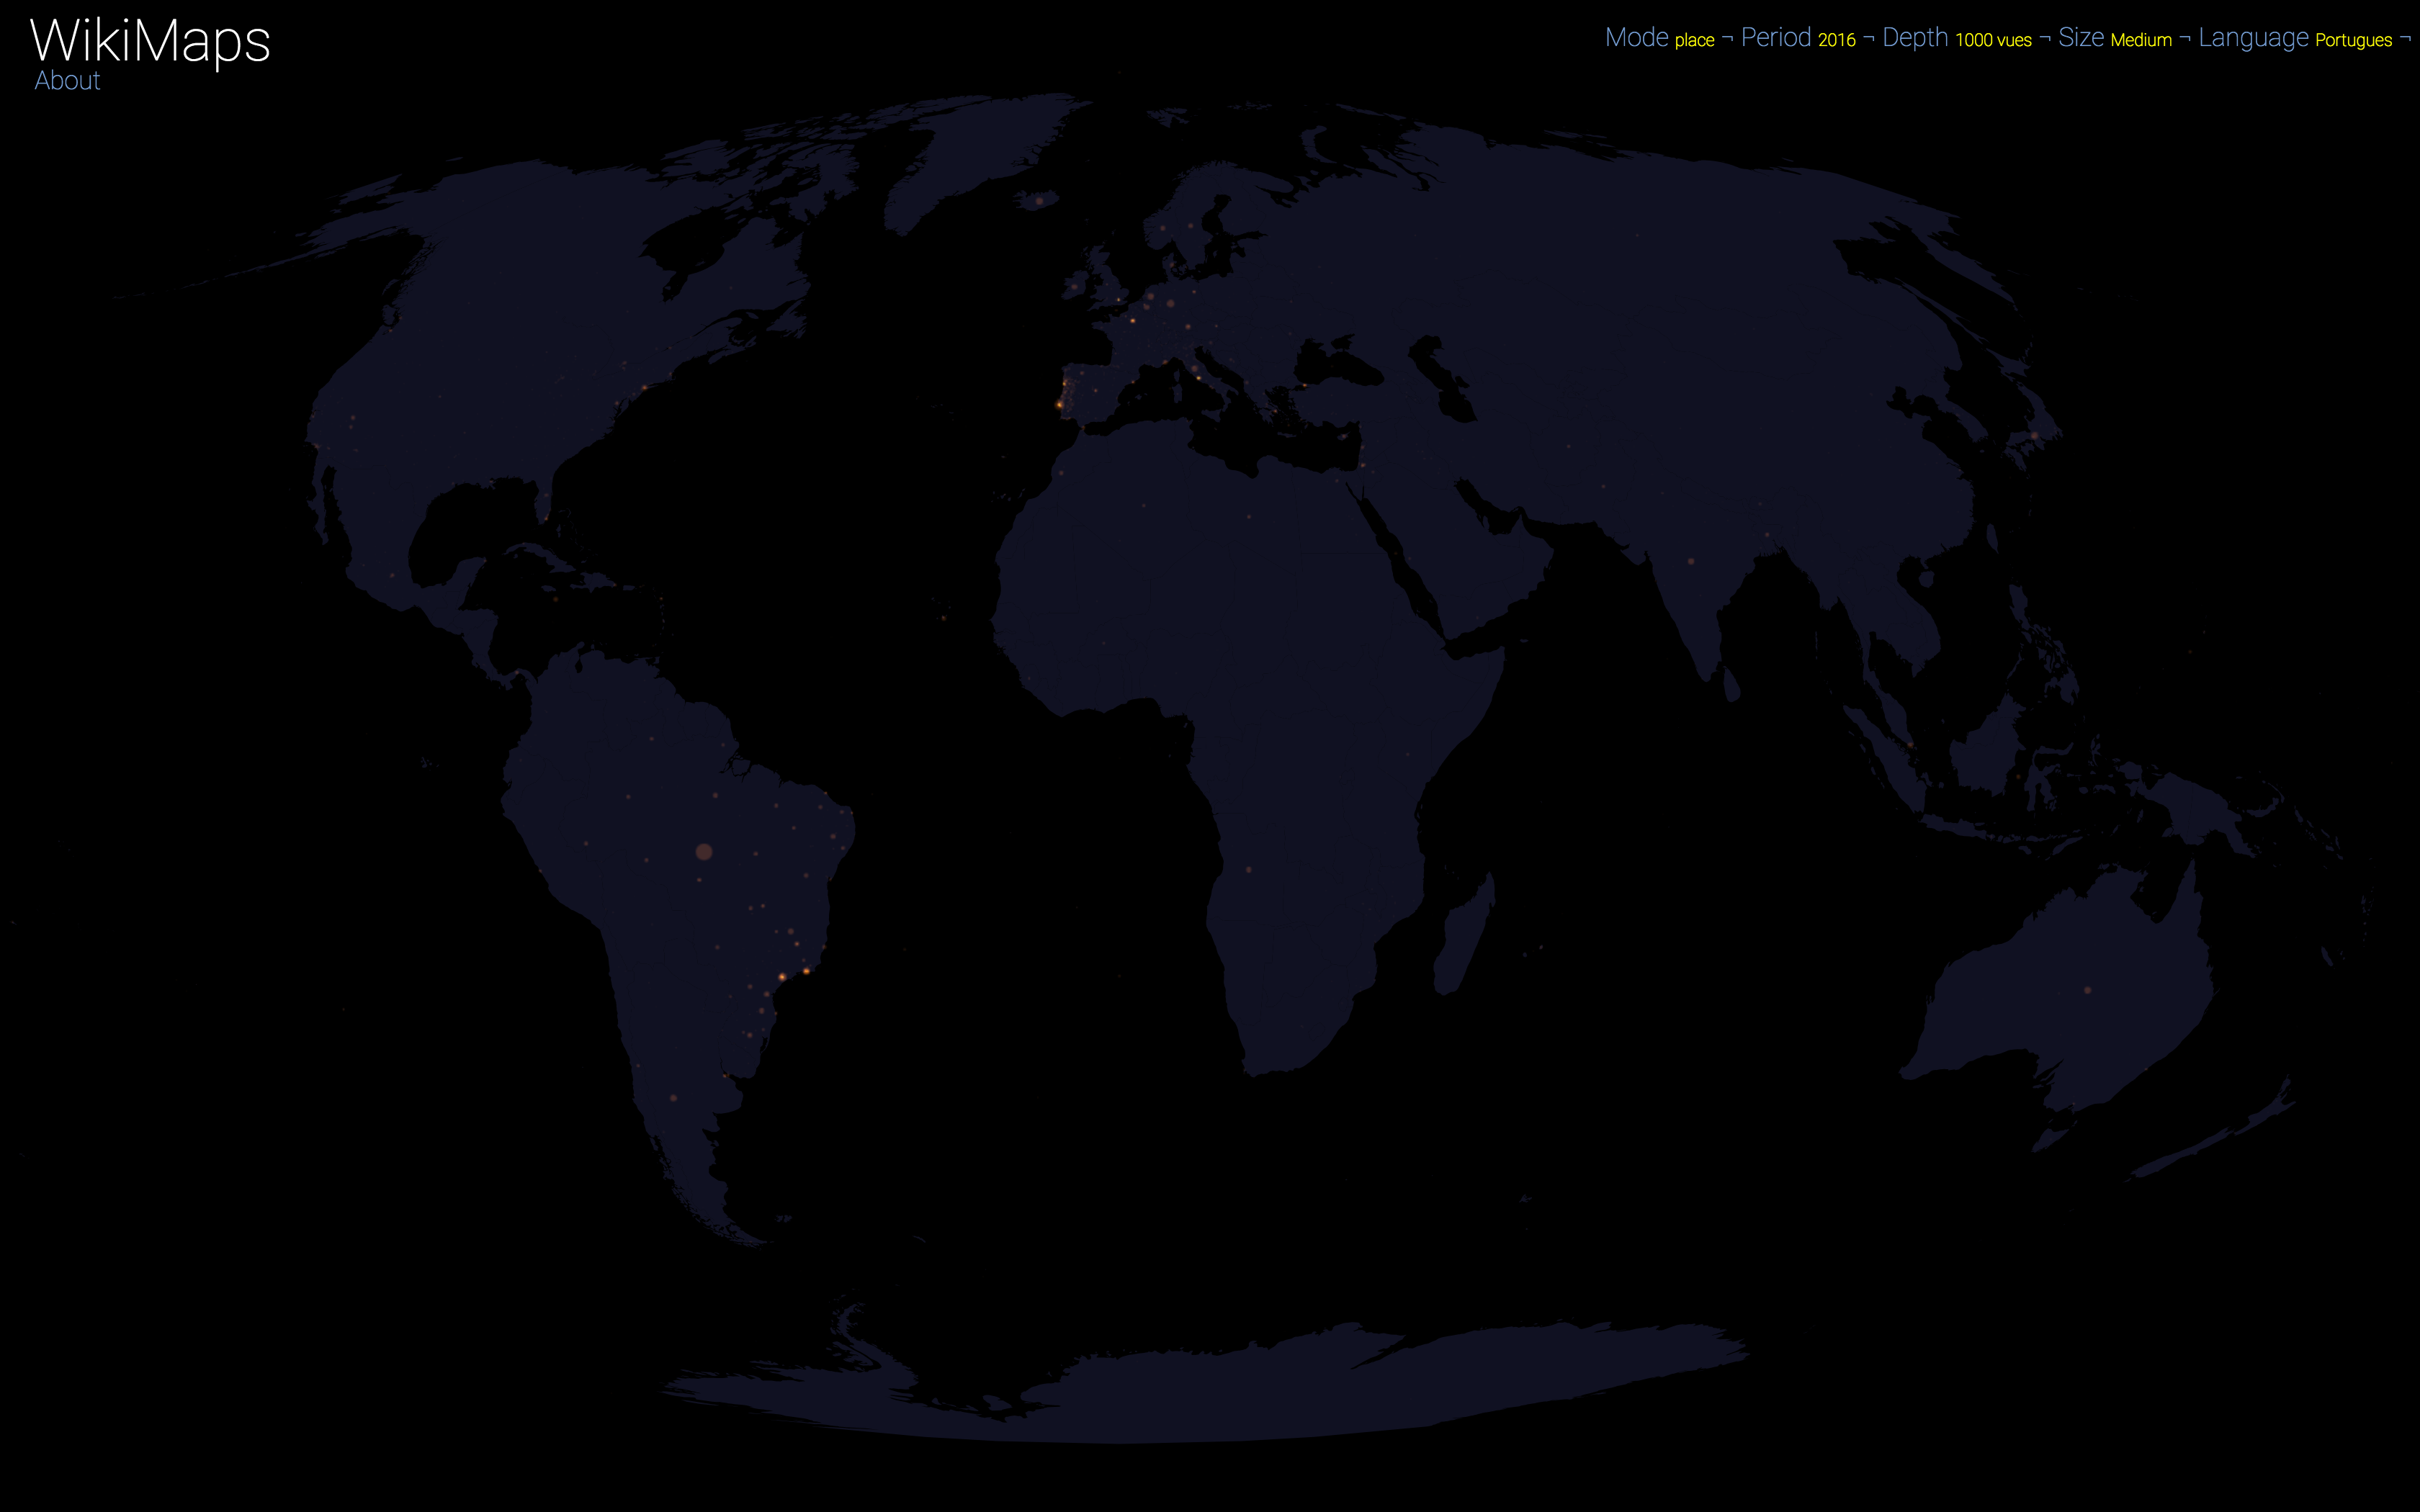
Portuguese 2016
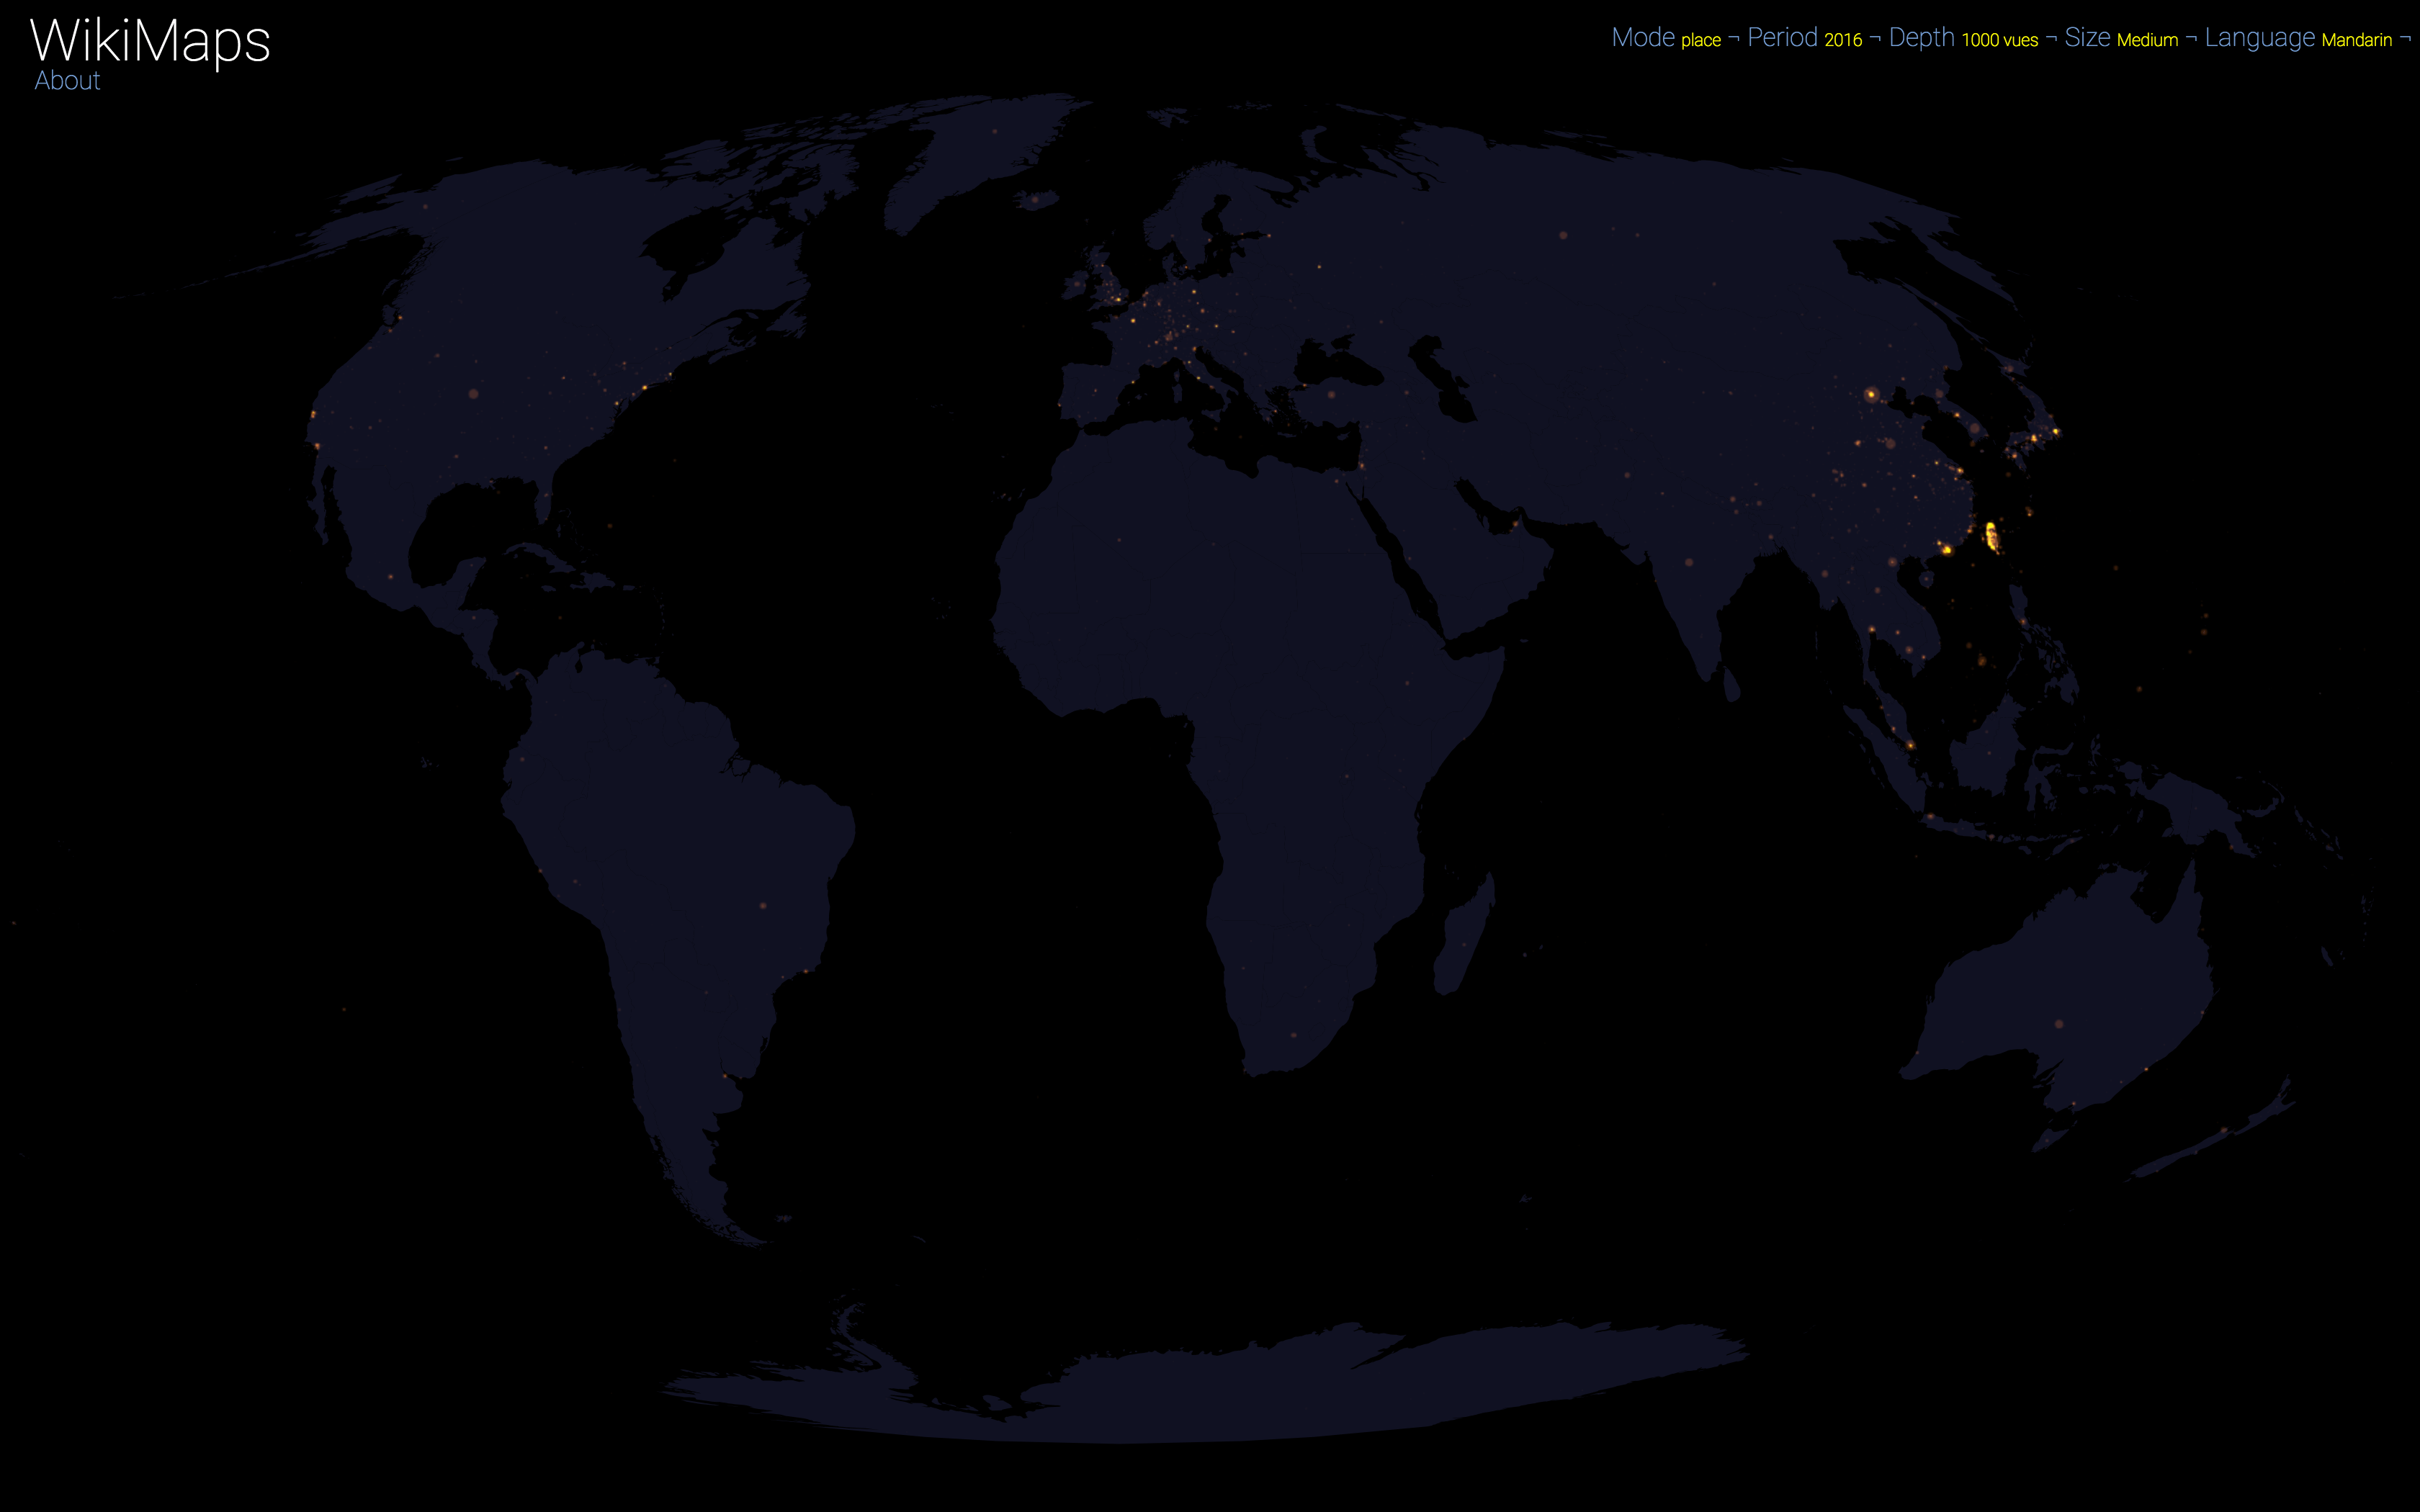
Mandarin 2016
On a global scale, the uneven distribution of attention across languages is particularly striking. English is by far the language that attracts the most widespread attention, albeit concentrated in English-speaking countries, including India. Spanish, because of its wide spatial distribution in Latin America, is also spread well beyond Spain. French, on the other hand, although widely spoken in Africa, is much less widespread, as Internet penetration is very low in most of the countries concerned. For all other languages, attention is almost exclusively concentrated within the areas corresponding to the linguistic area of the edition being considered.
Mandarin is an exception, since Wikipedia is used marginally in China. It is therefore the most westernised part that appears (Hong Kong and Taiwan).
Finally, there are spaces that stand out in all languages. These are essentially the most globalised metropolitan areas and the most touristic places.
Zoom
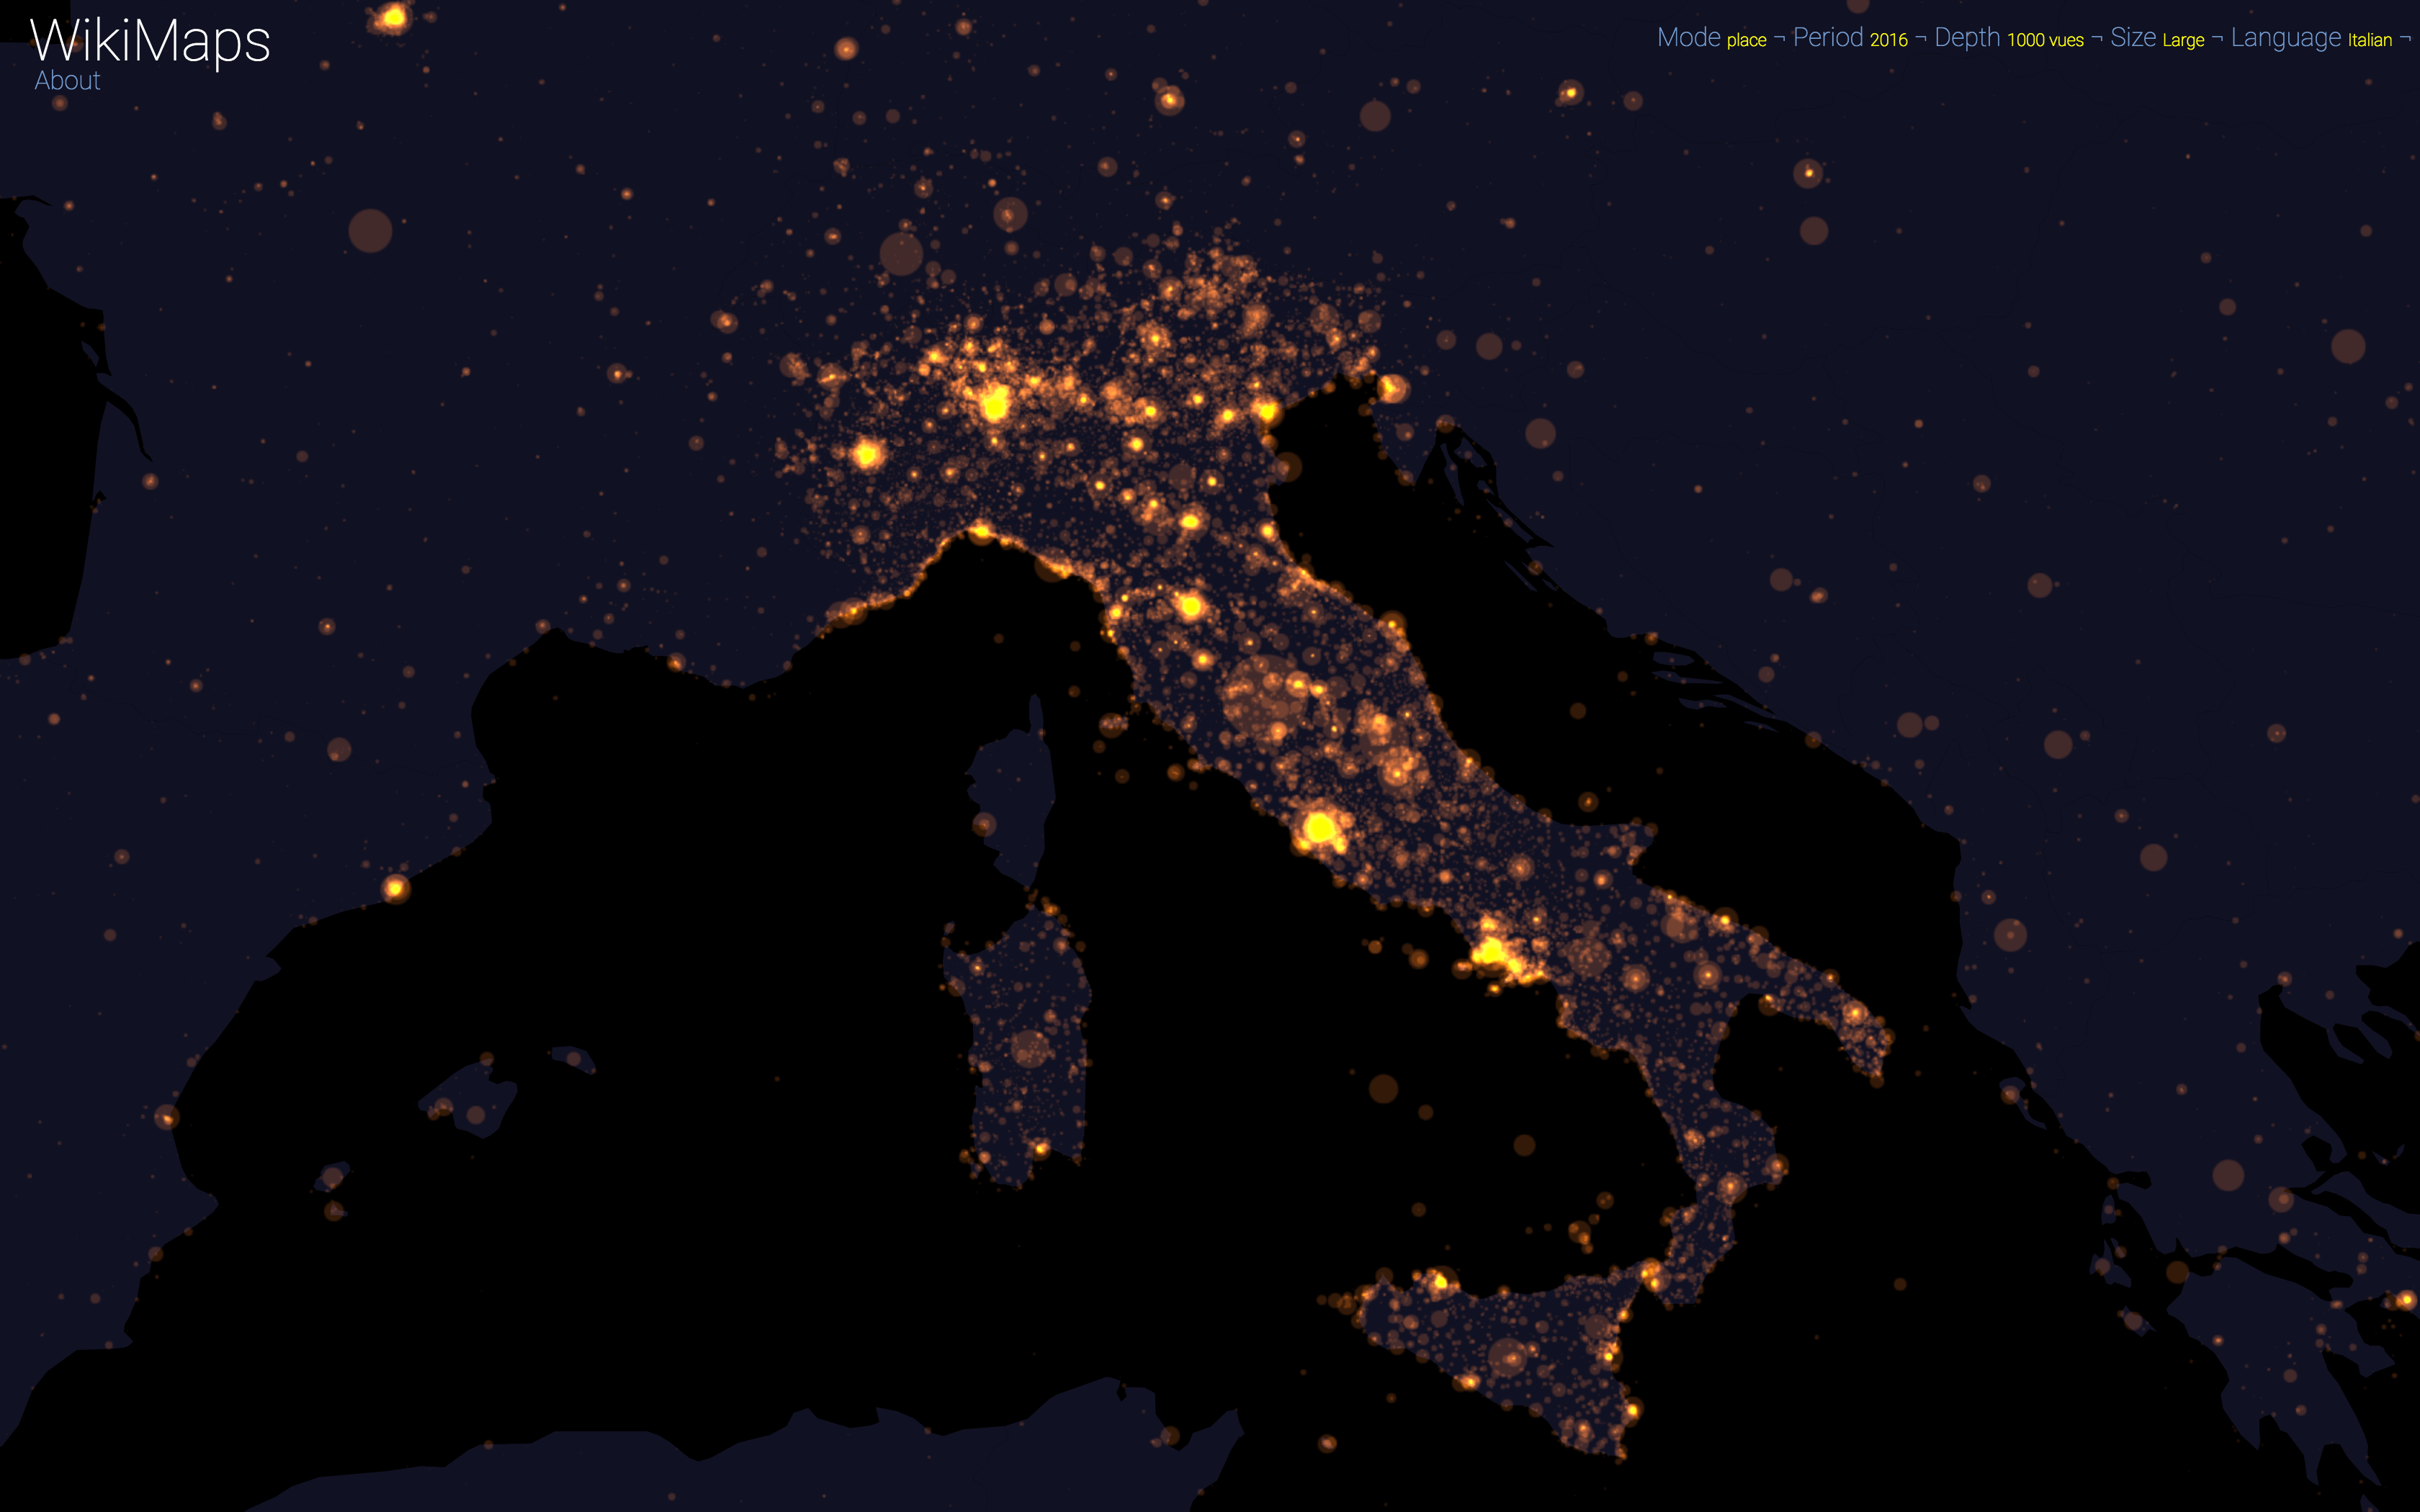
Italia - Italian - 2016
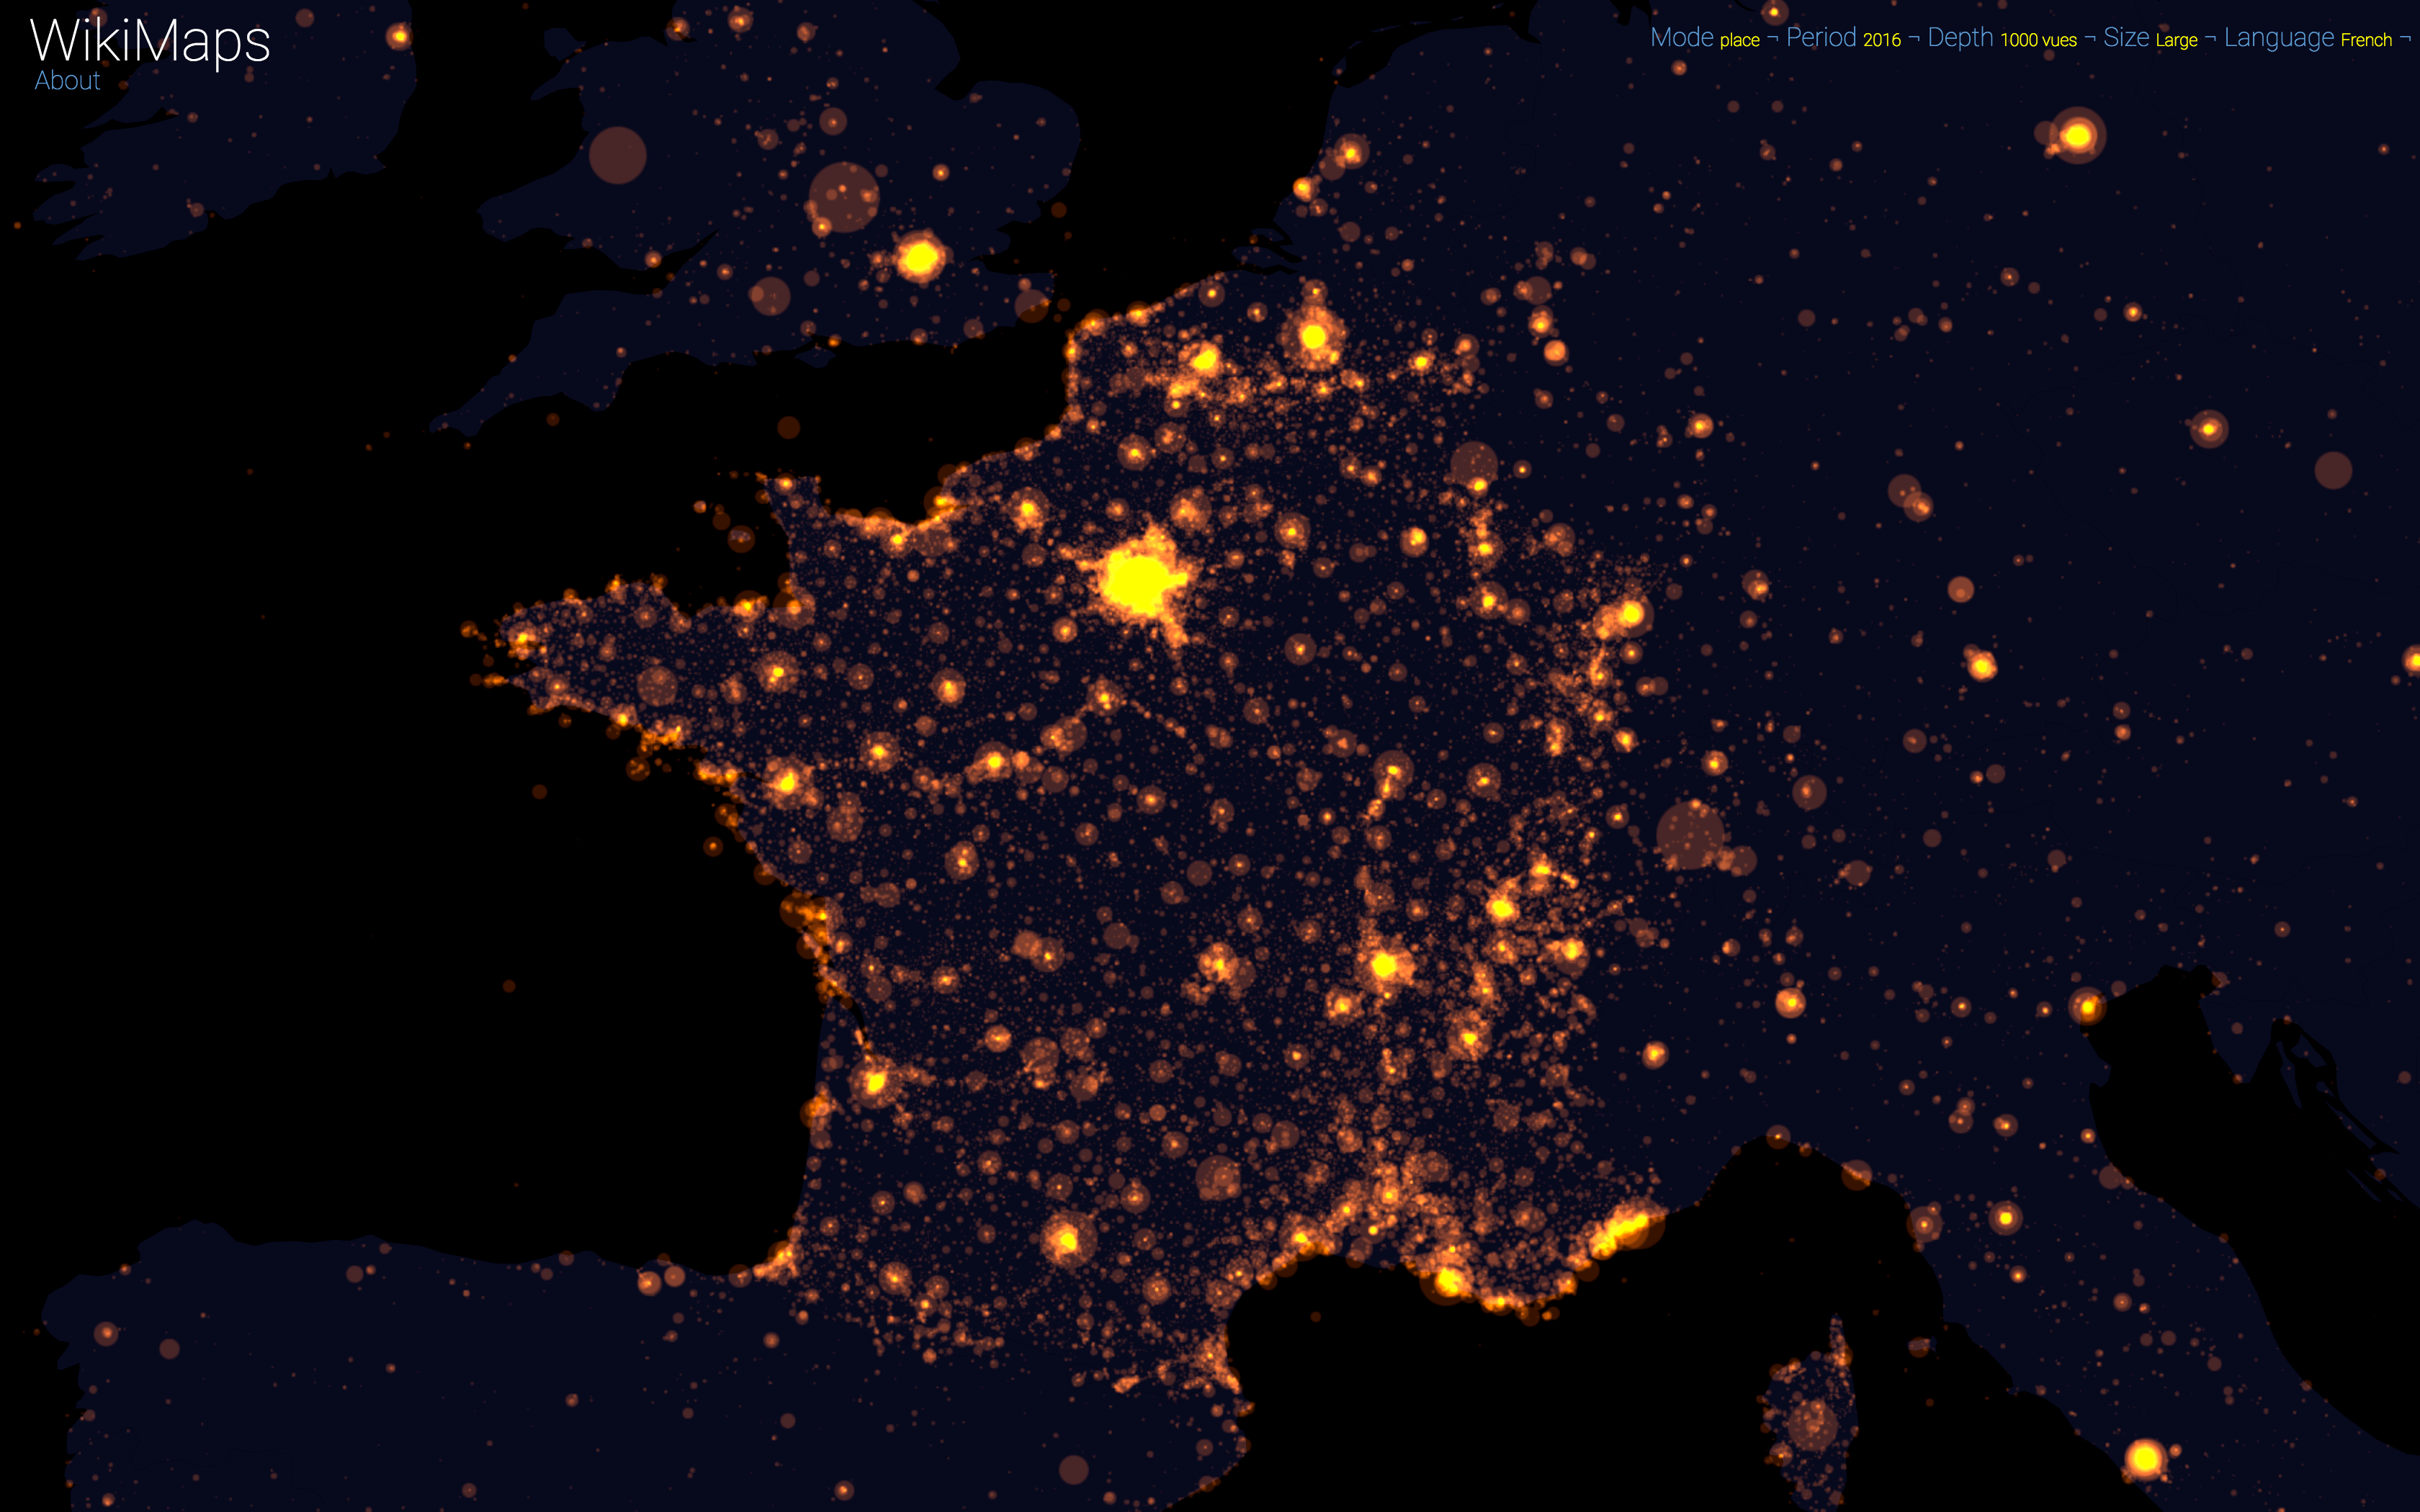
France - French - 2016
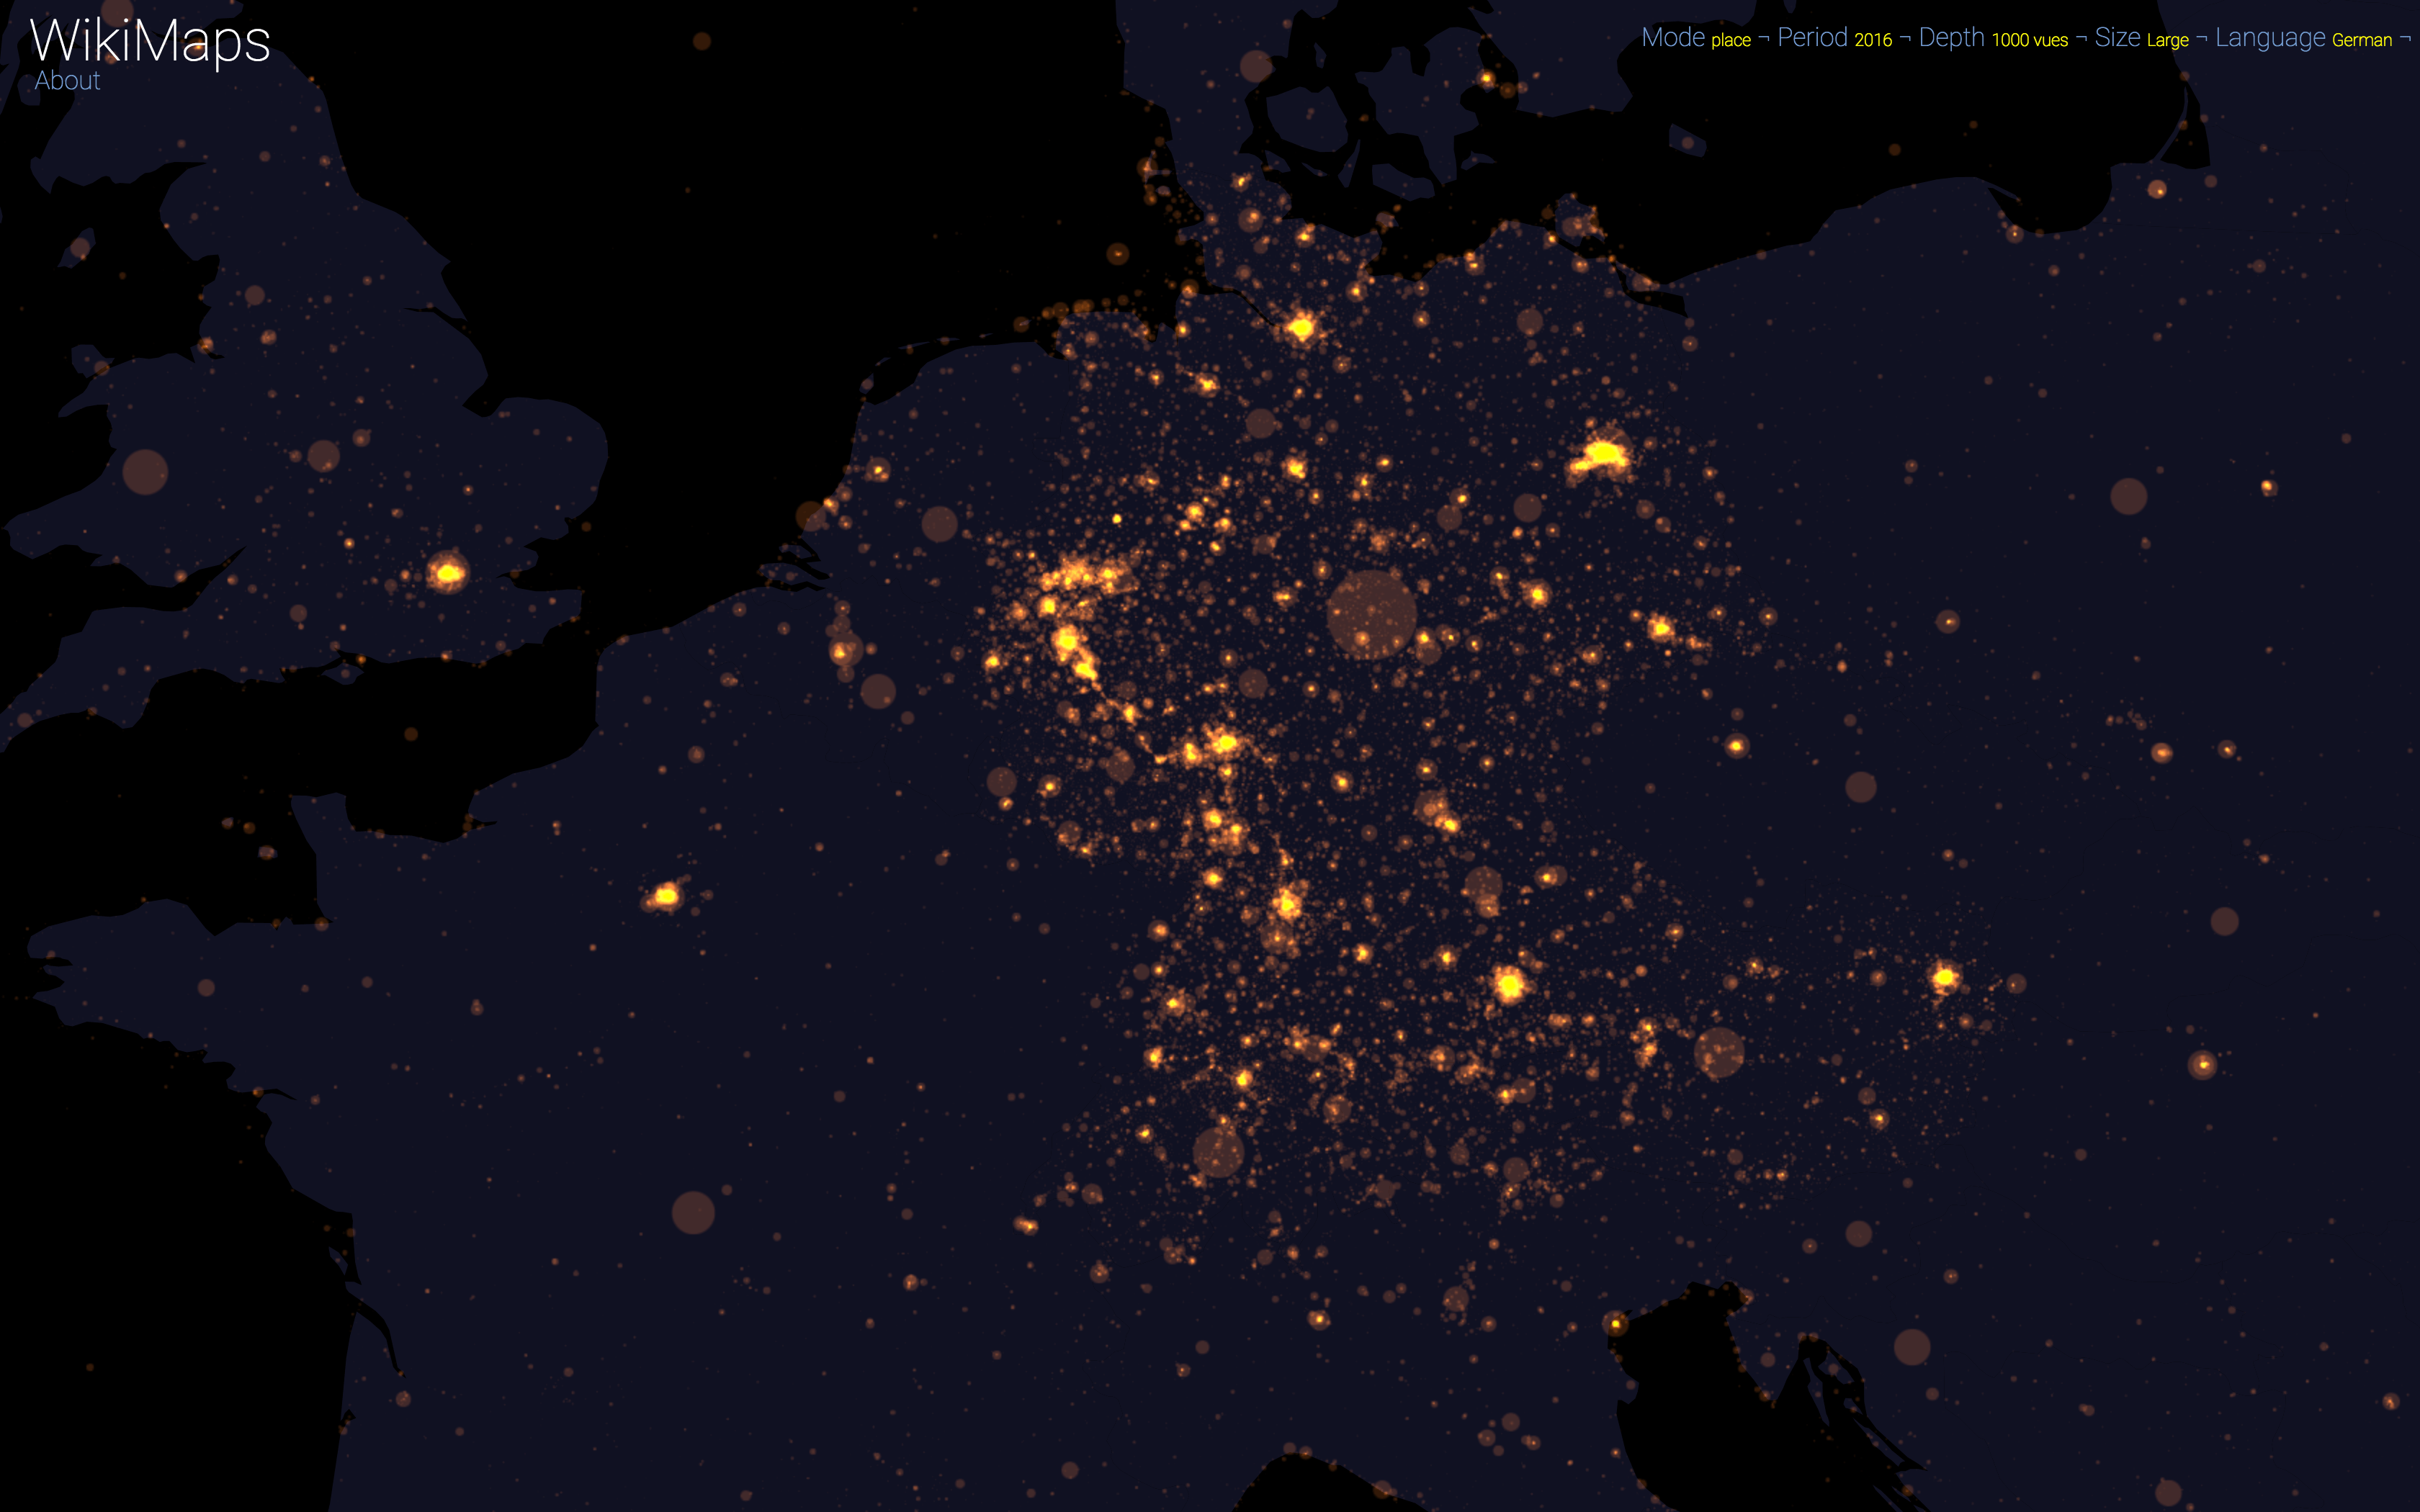
Germany - German - 2016
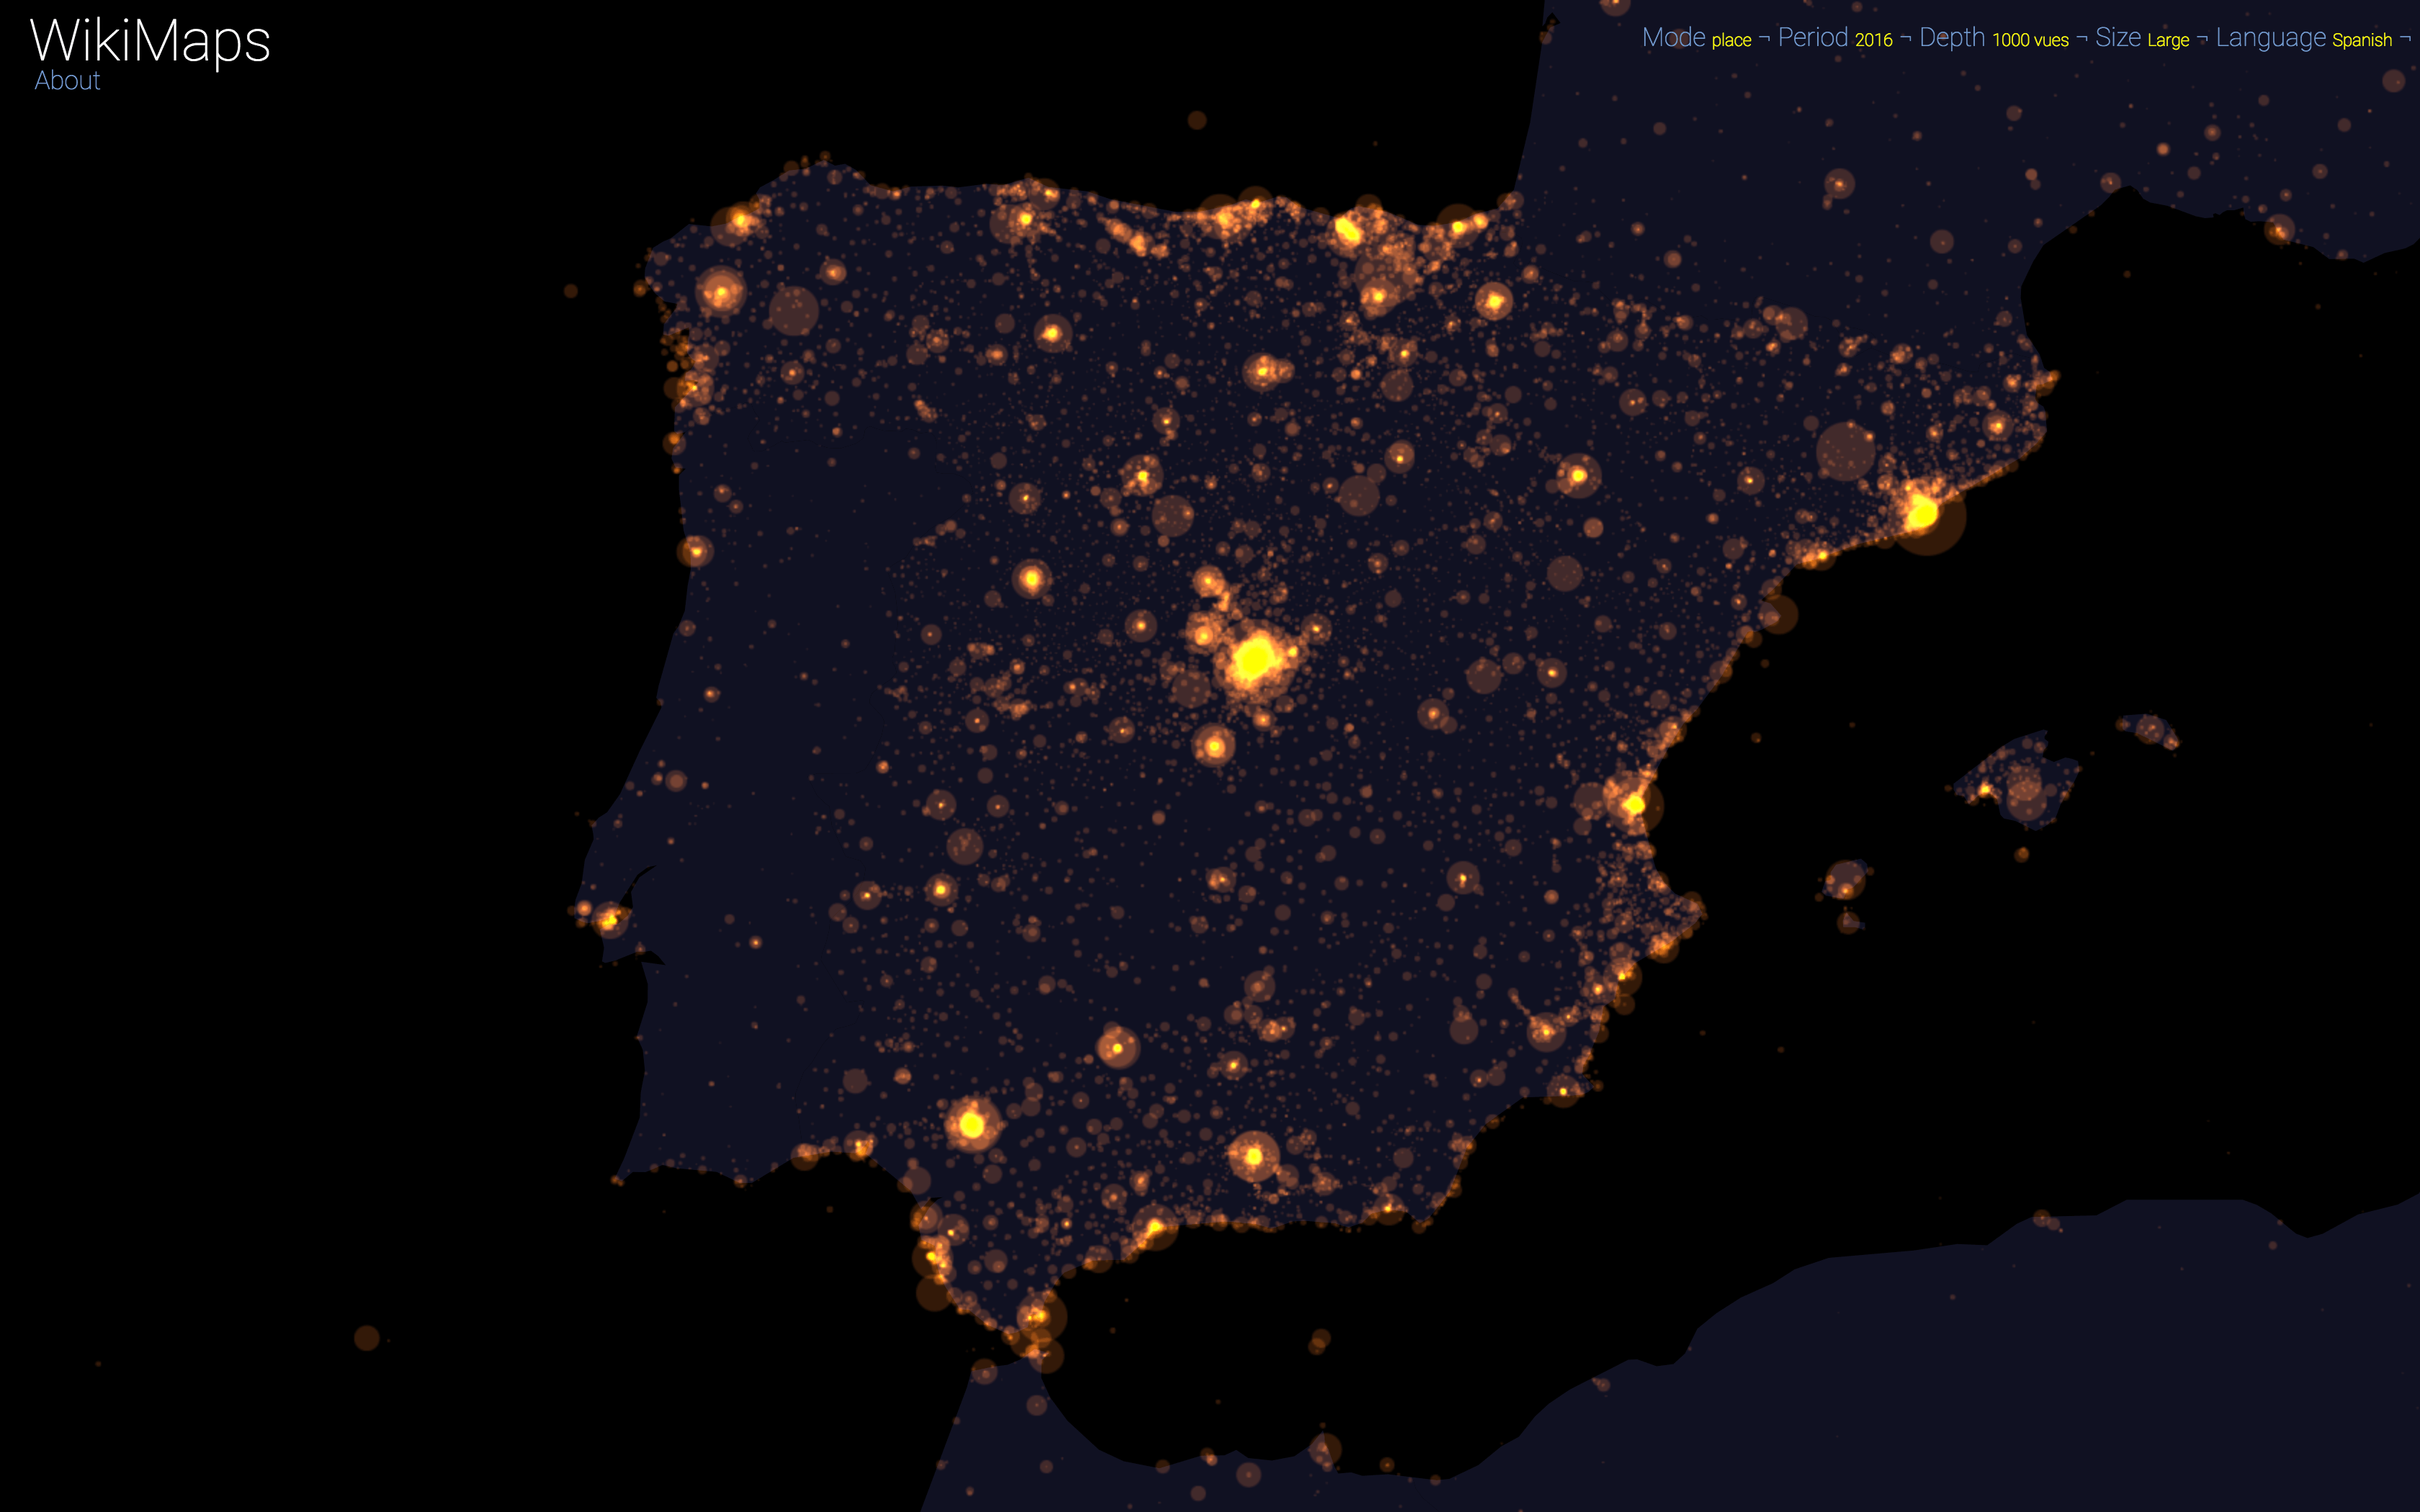
Spain - Spanish - 2016
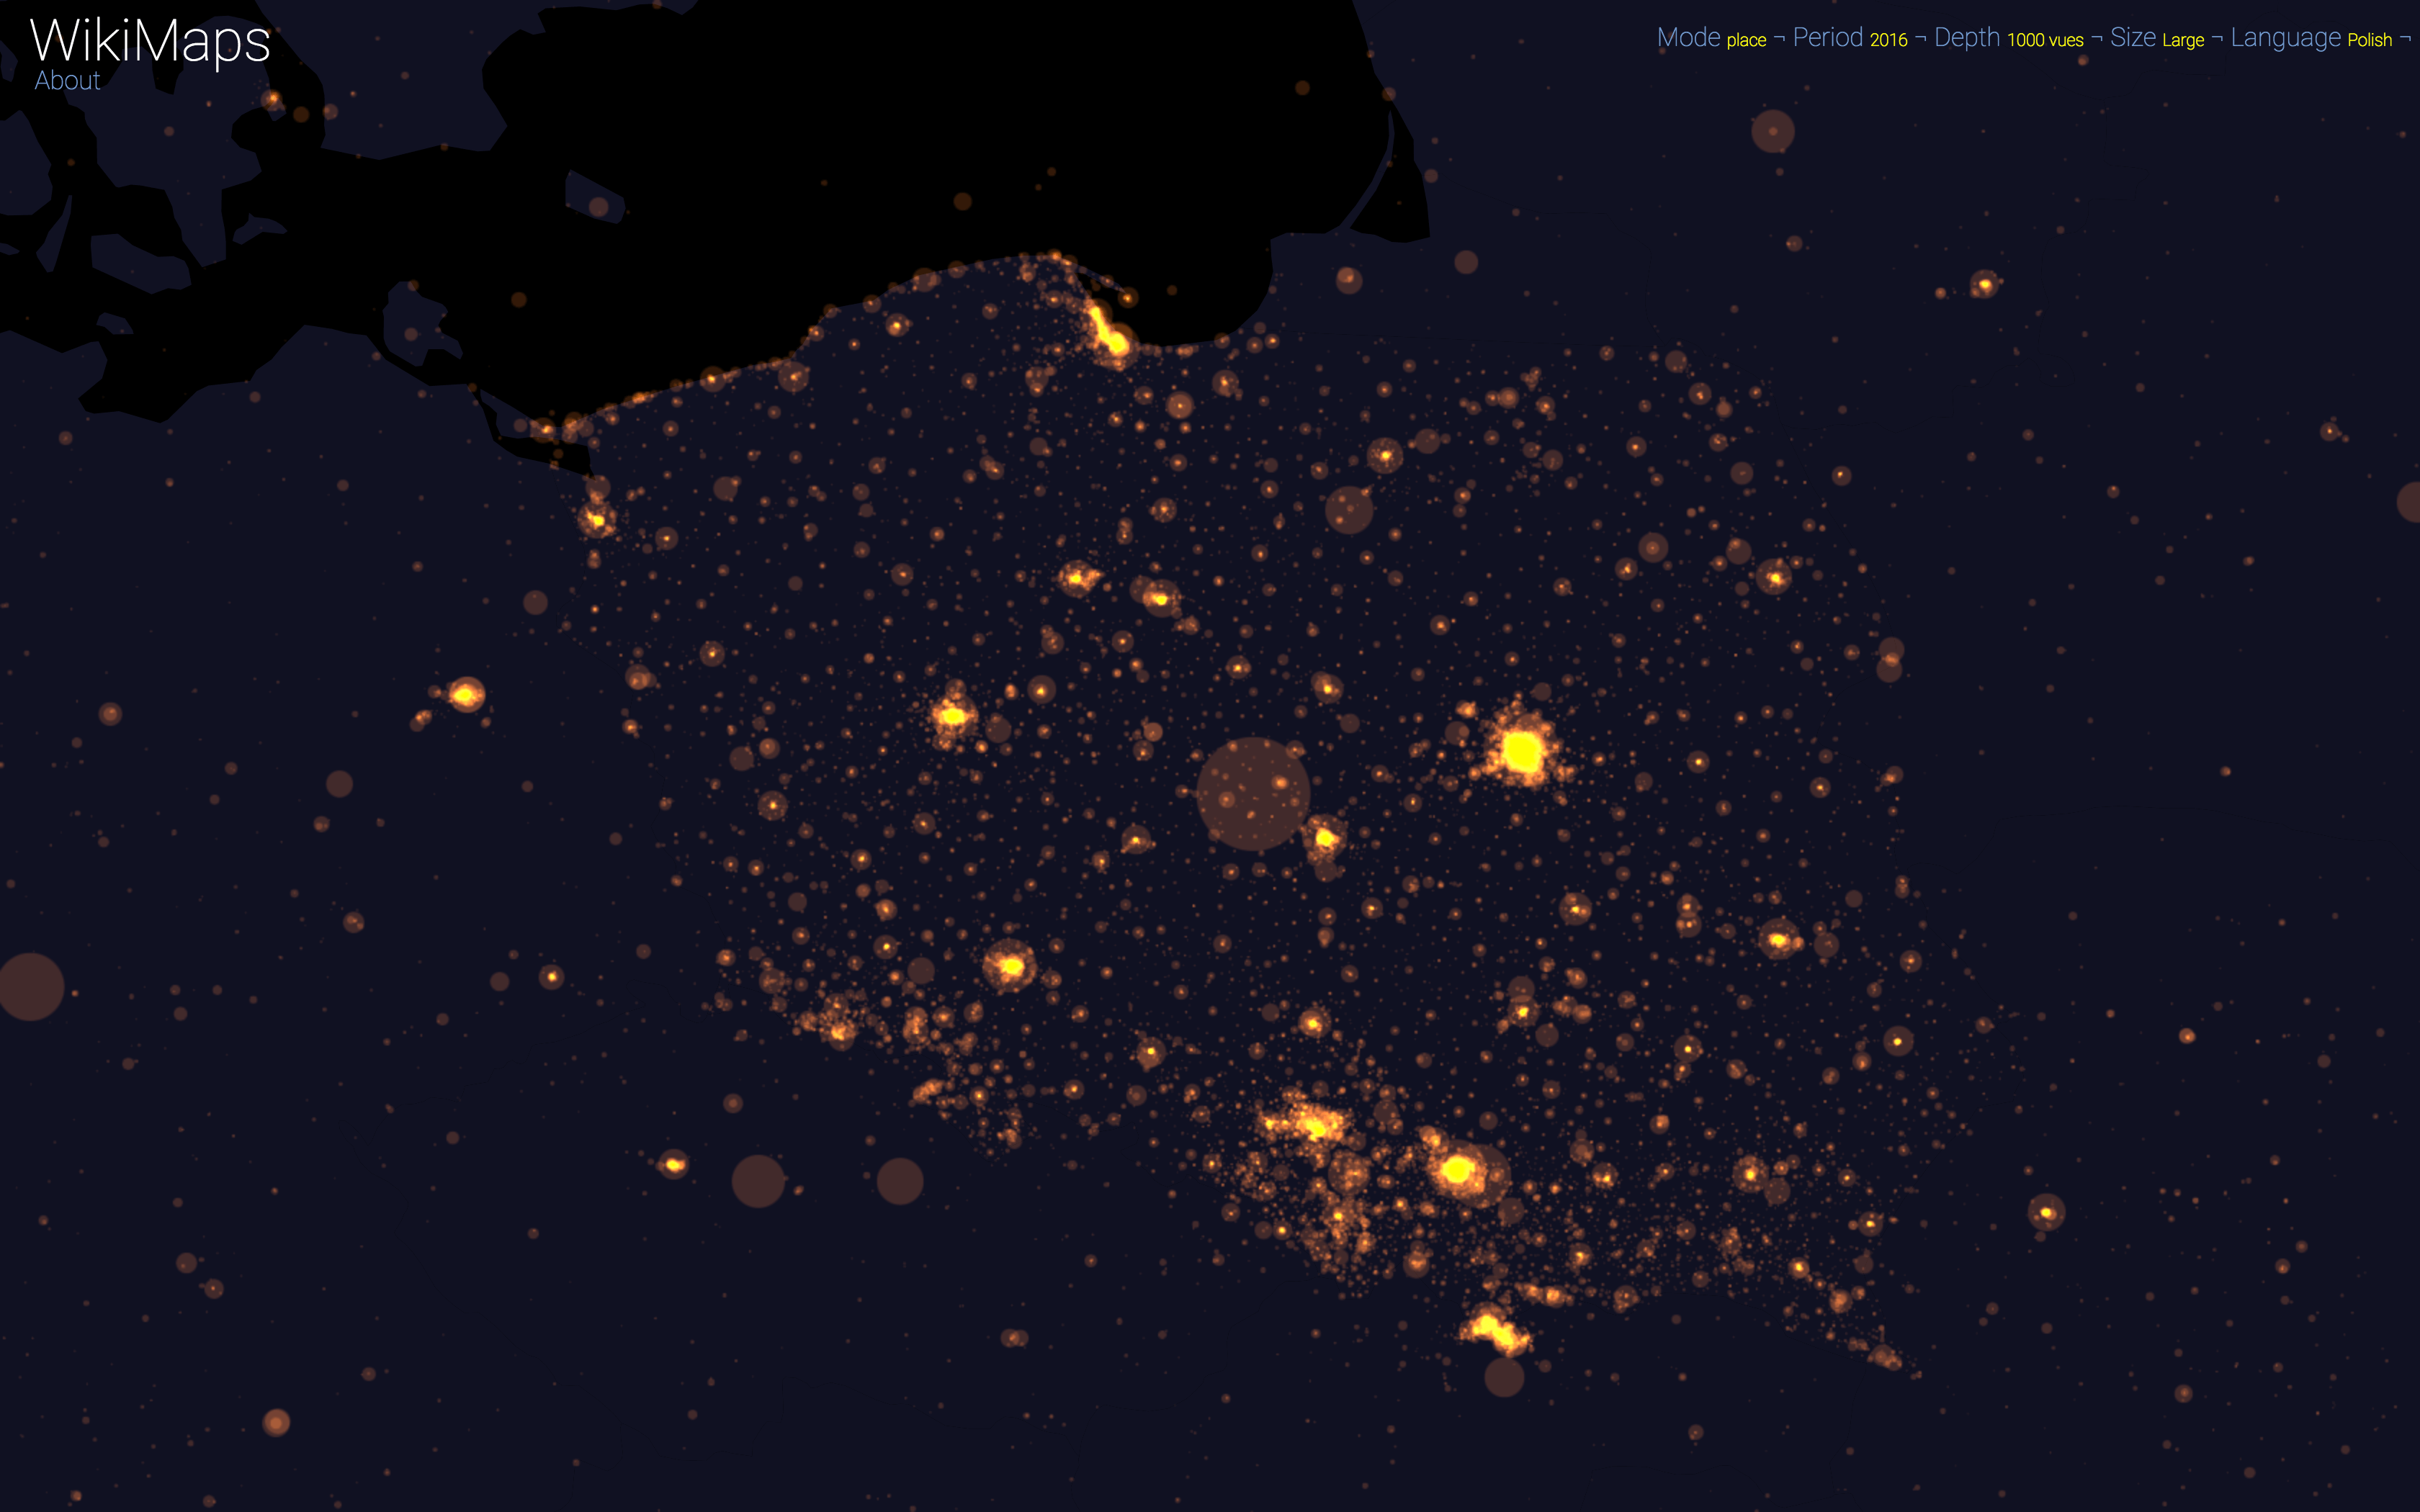
Poland - Polish - 2016
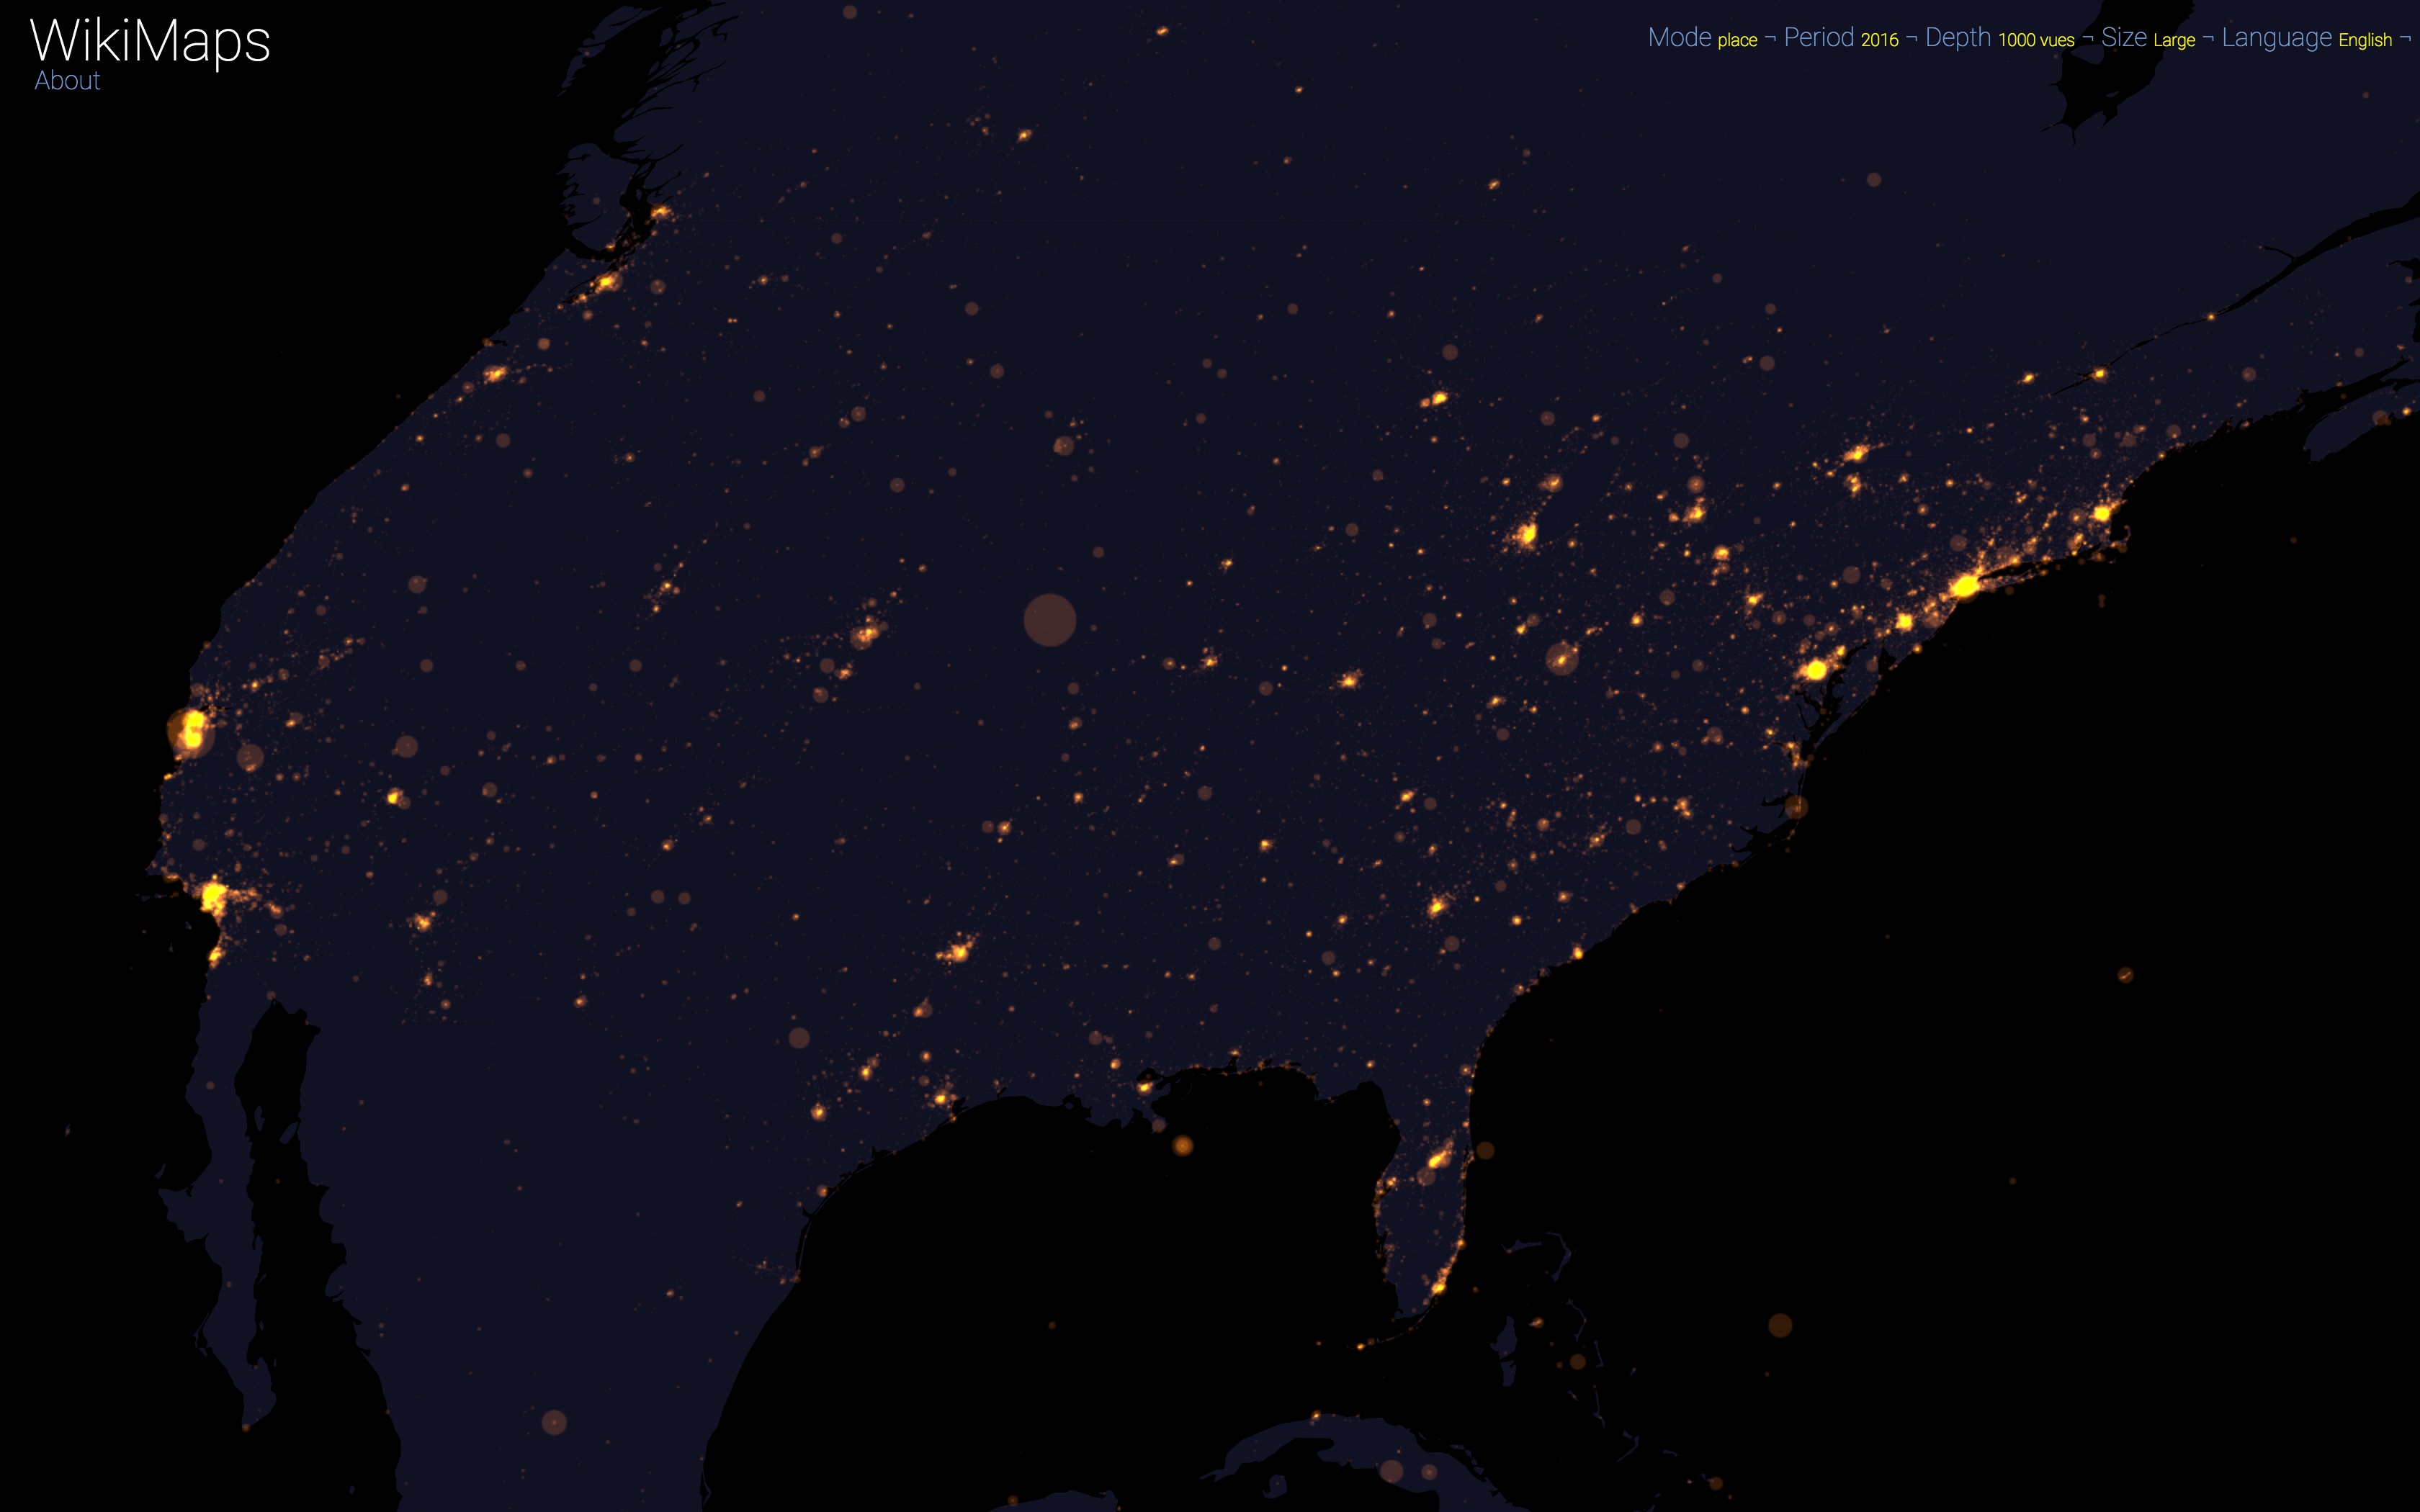
United States - English - 2016
United Kingdom - English - 2016
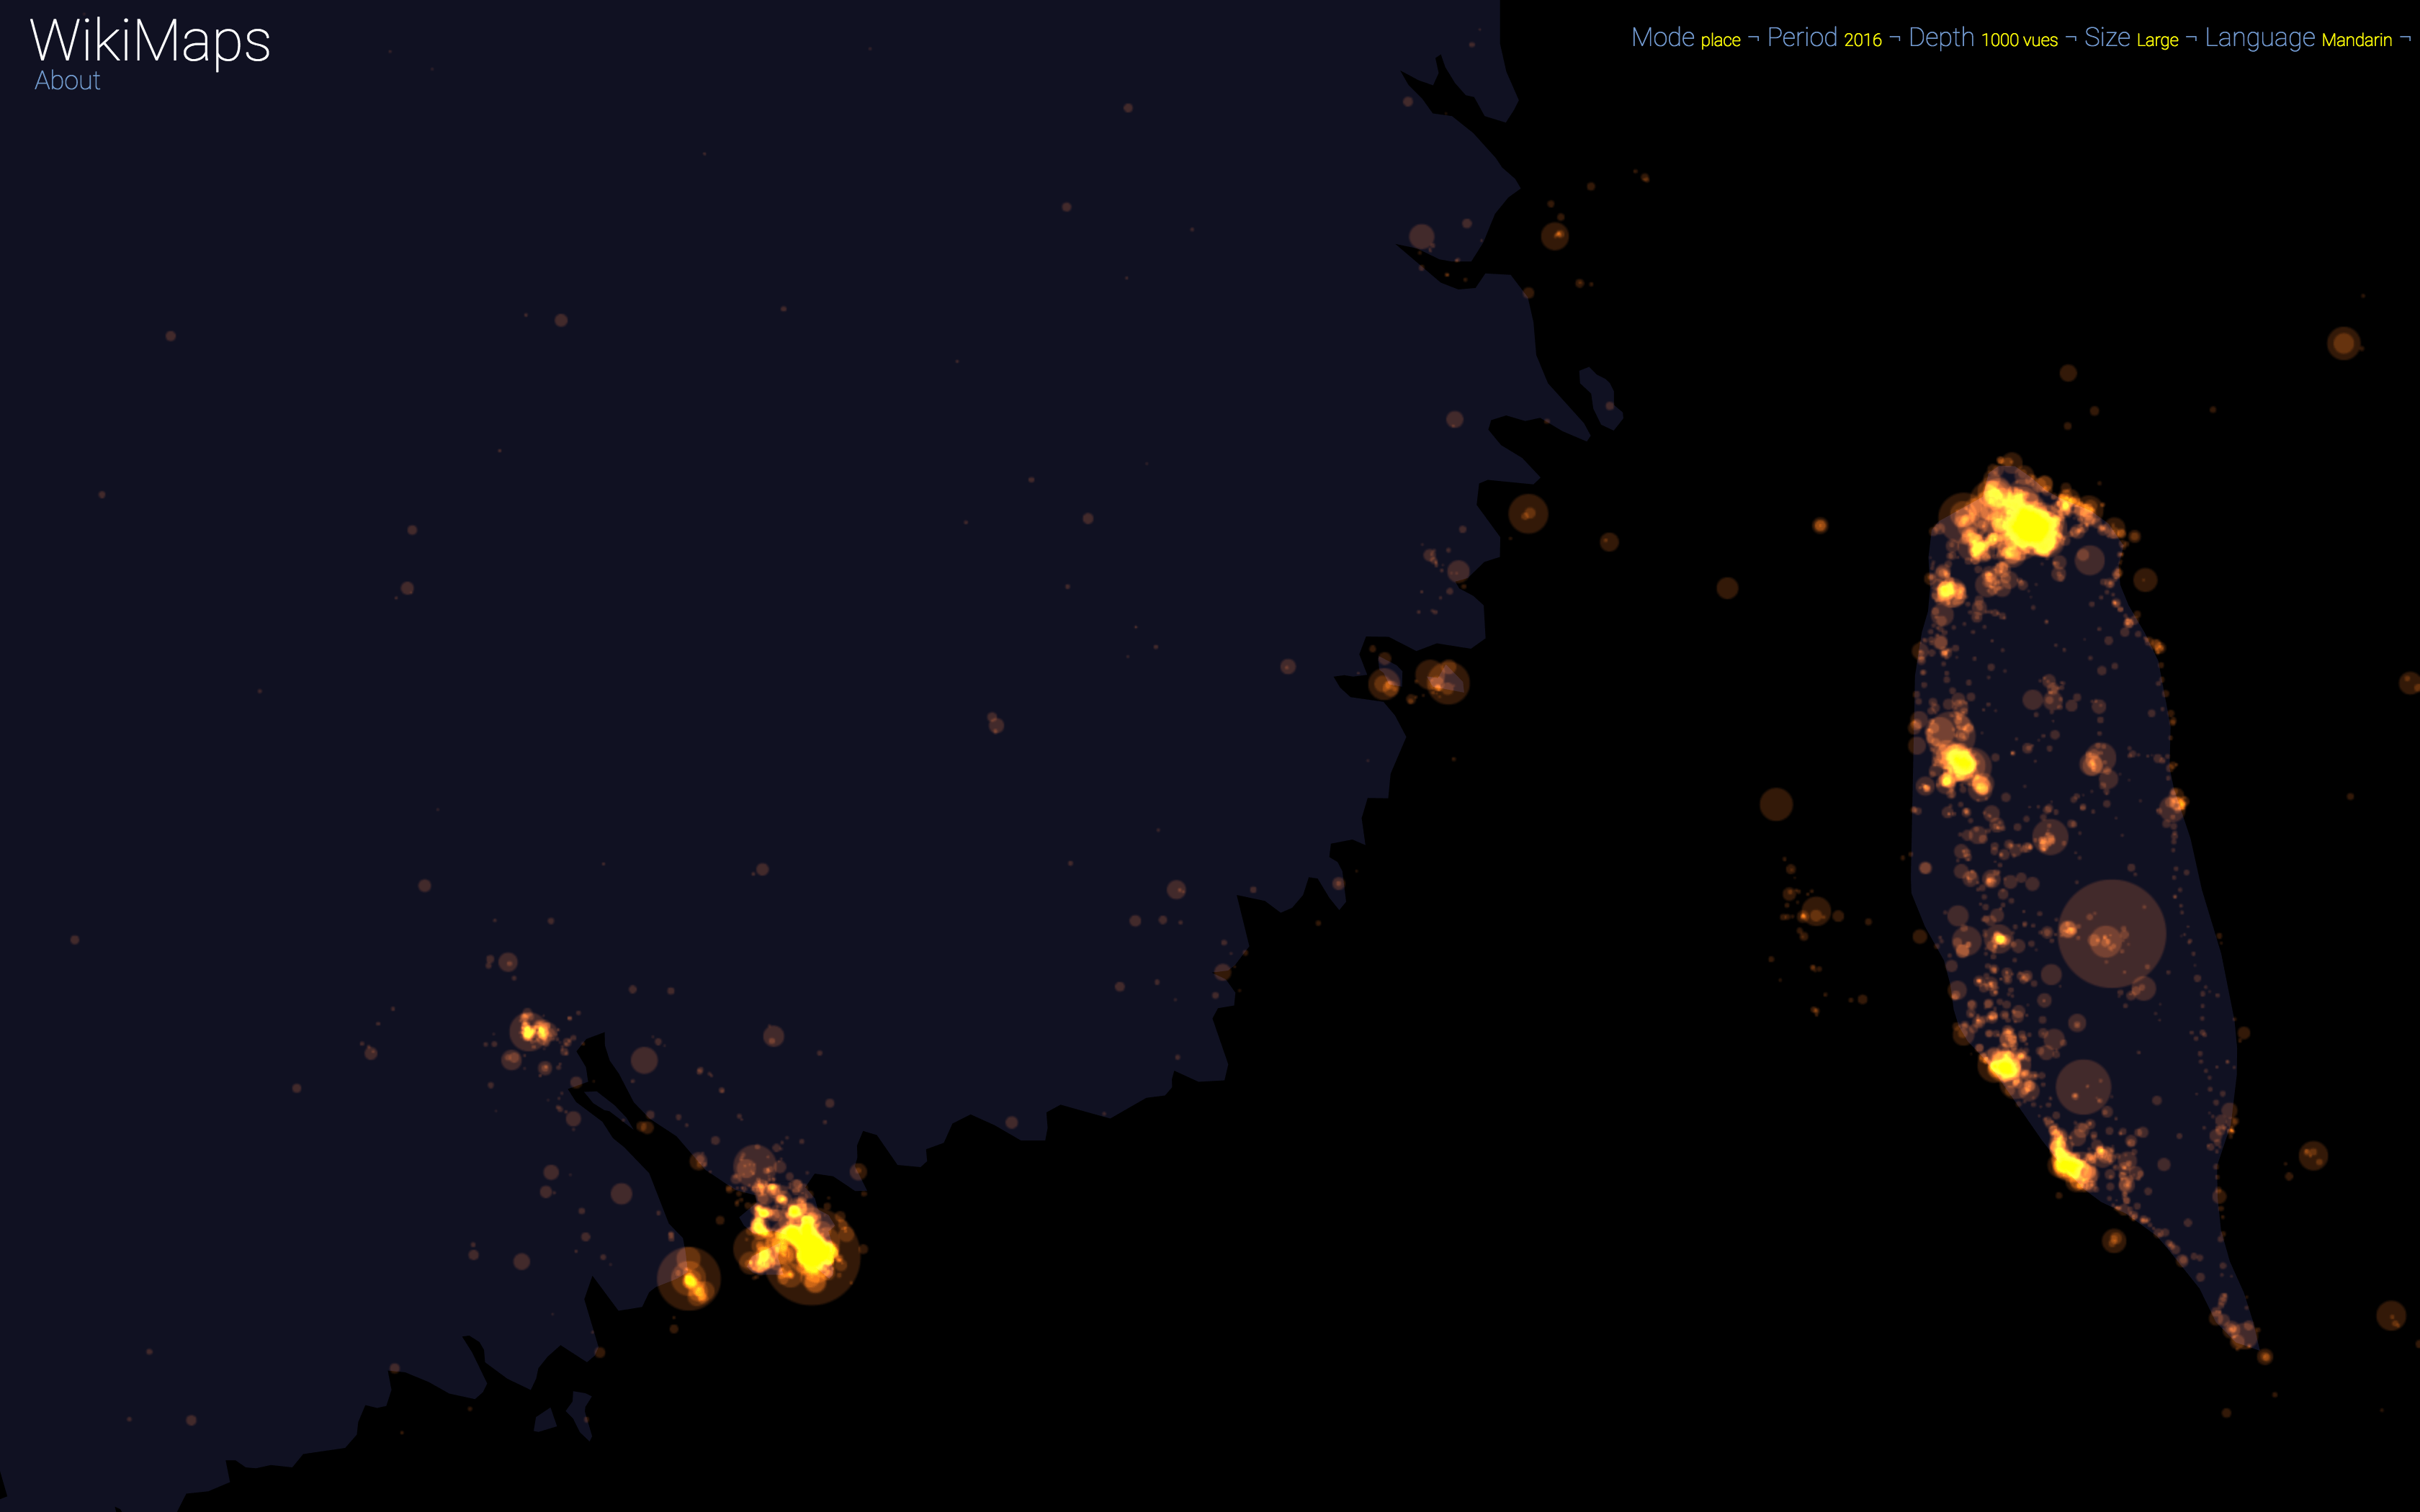
Hong Kong / Taiwan - Mandarin - 2016
WikiMaps allows to zoom on any part of the world. It is thus possible to observe more precisely phenomena relating to a particular edition of Wikipedia (language) and to identify many details, revealing a very clear hierarchy within each space belonging to a particular linguistic area.
Time
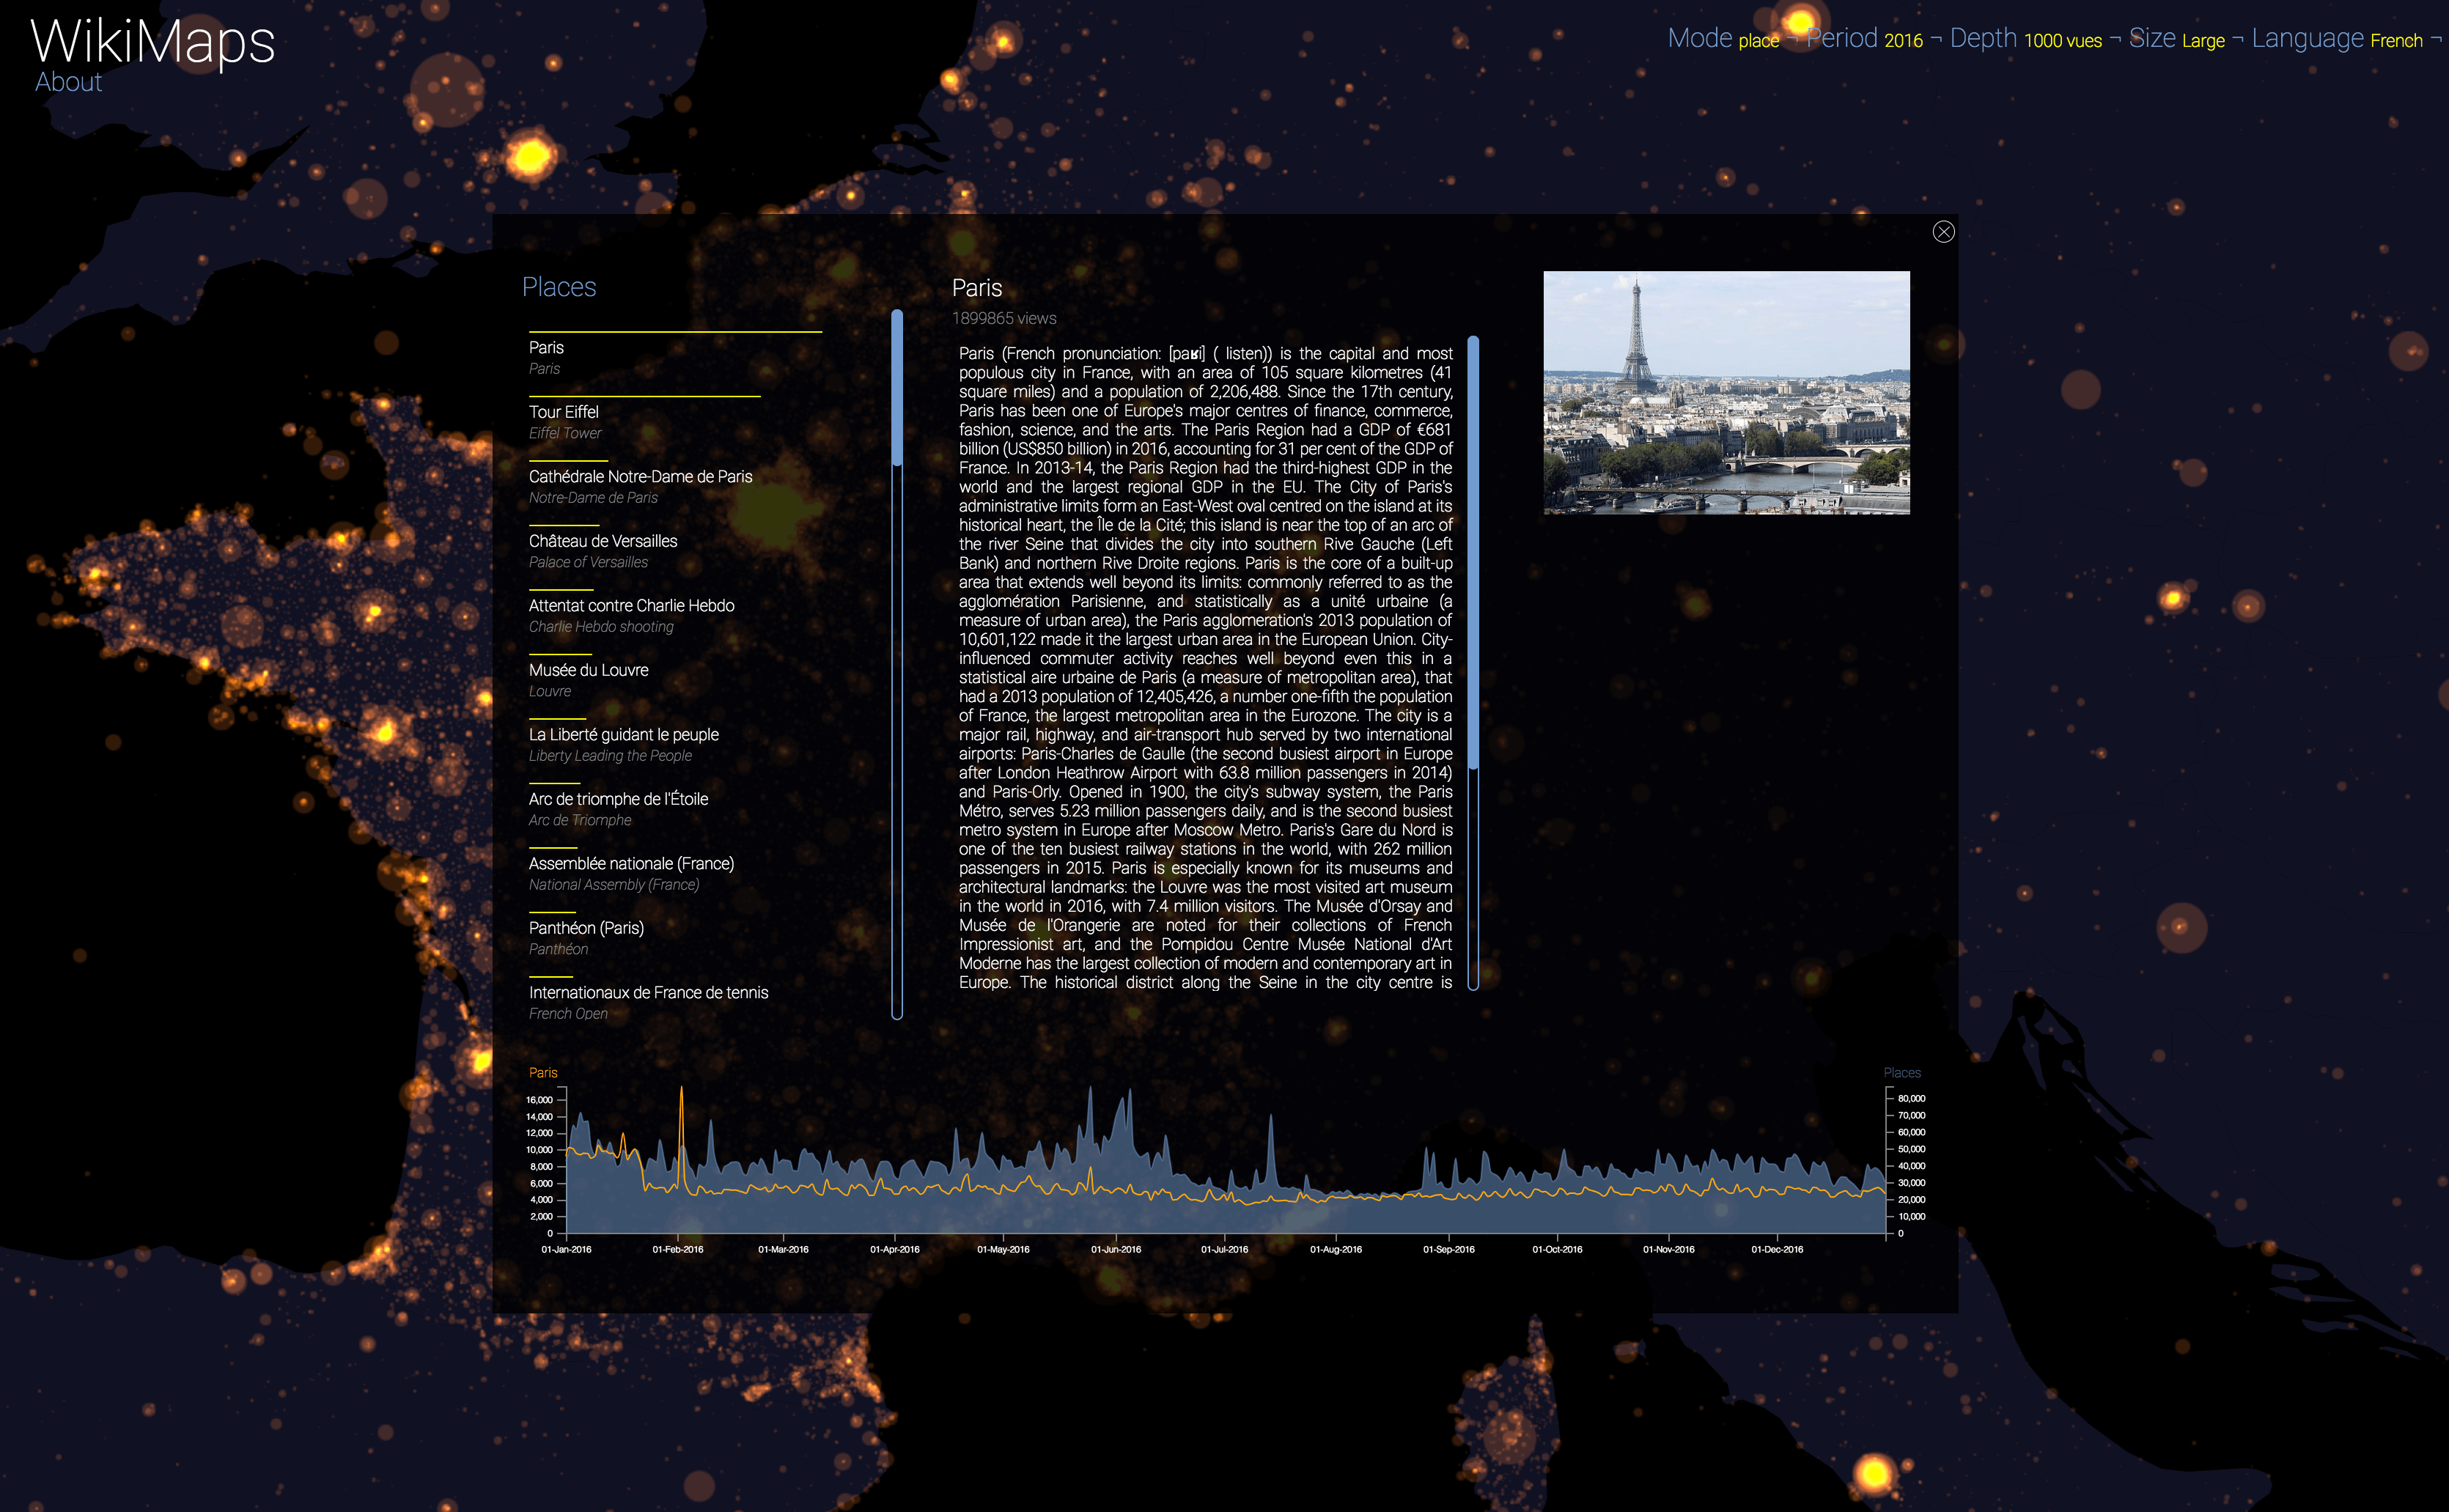
Paris - French - 2016
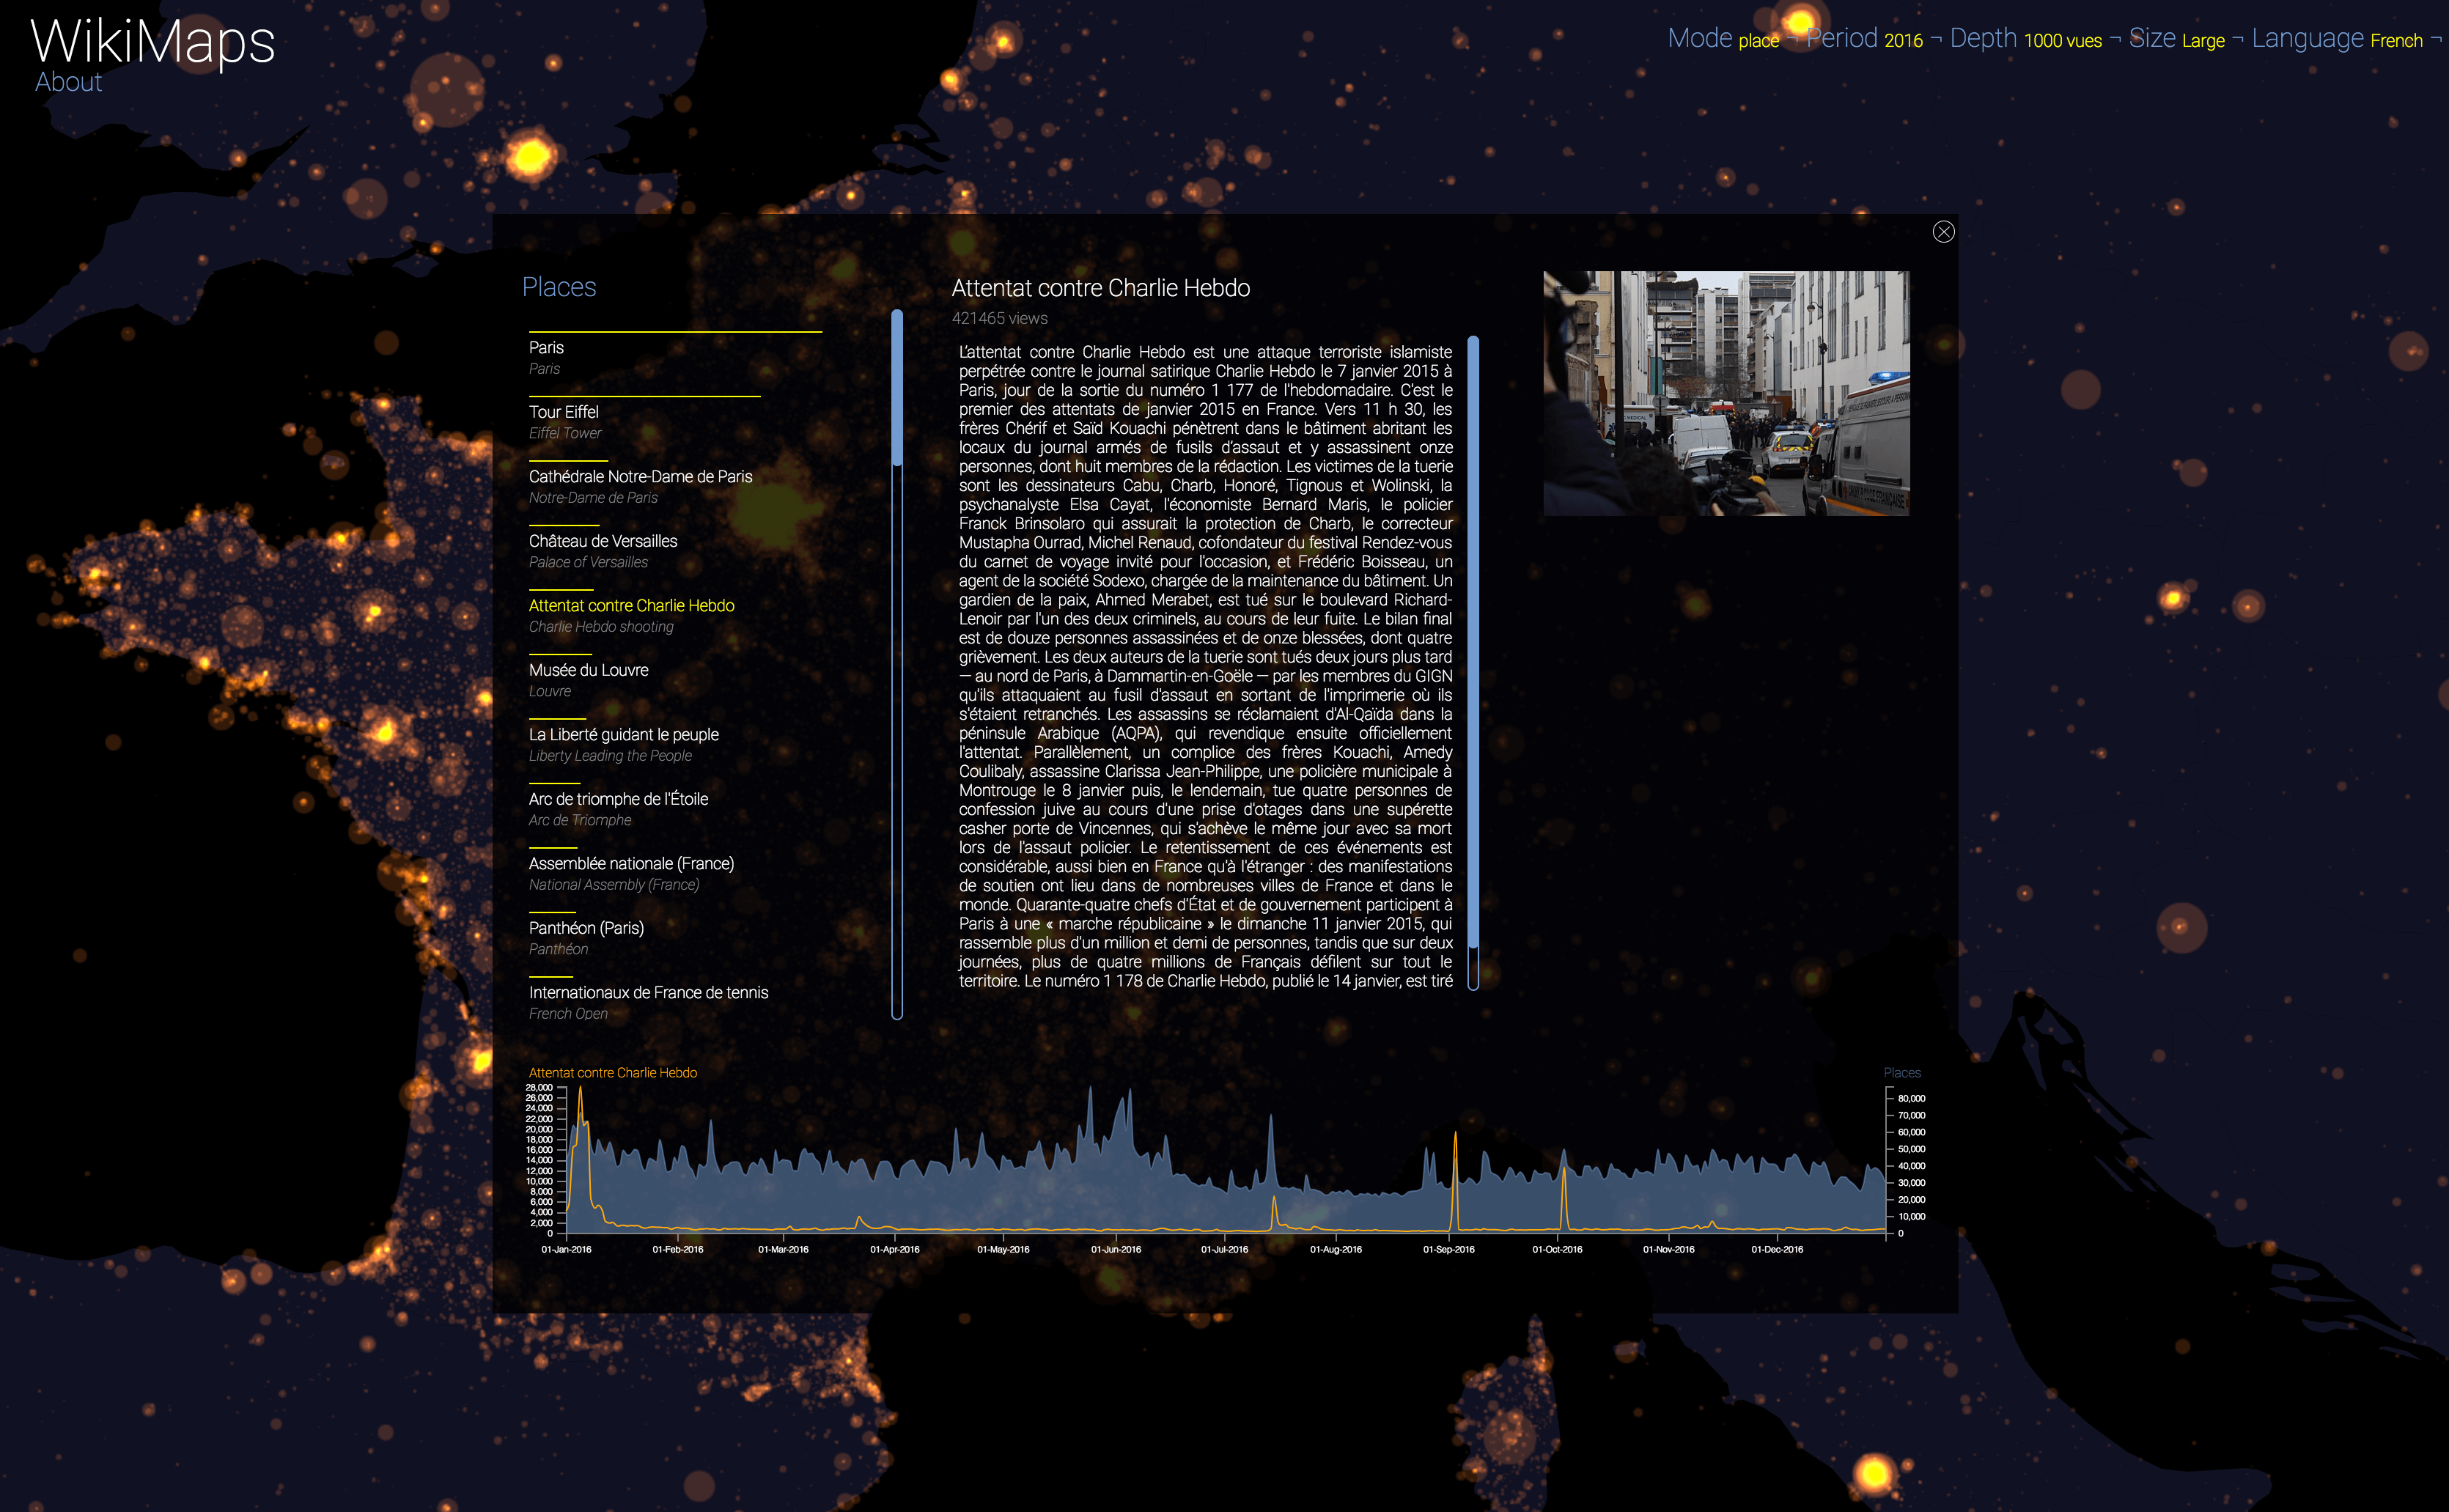
Attentat contre Charlie Hebdo - French - 2016
Conseil d’Etat - French - 2016
Conseil constitutionnel - French - 2016
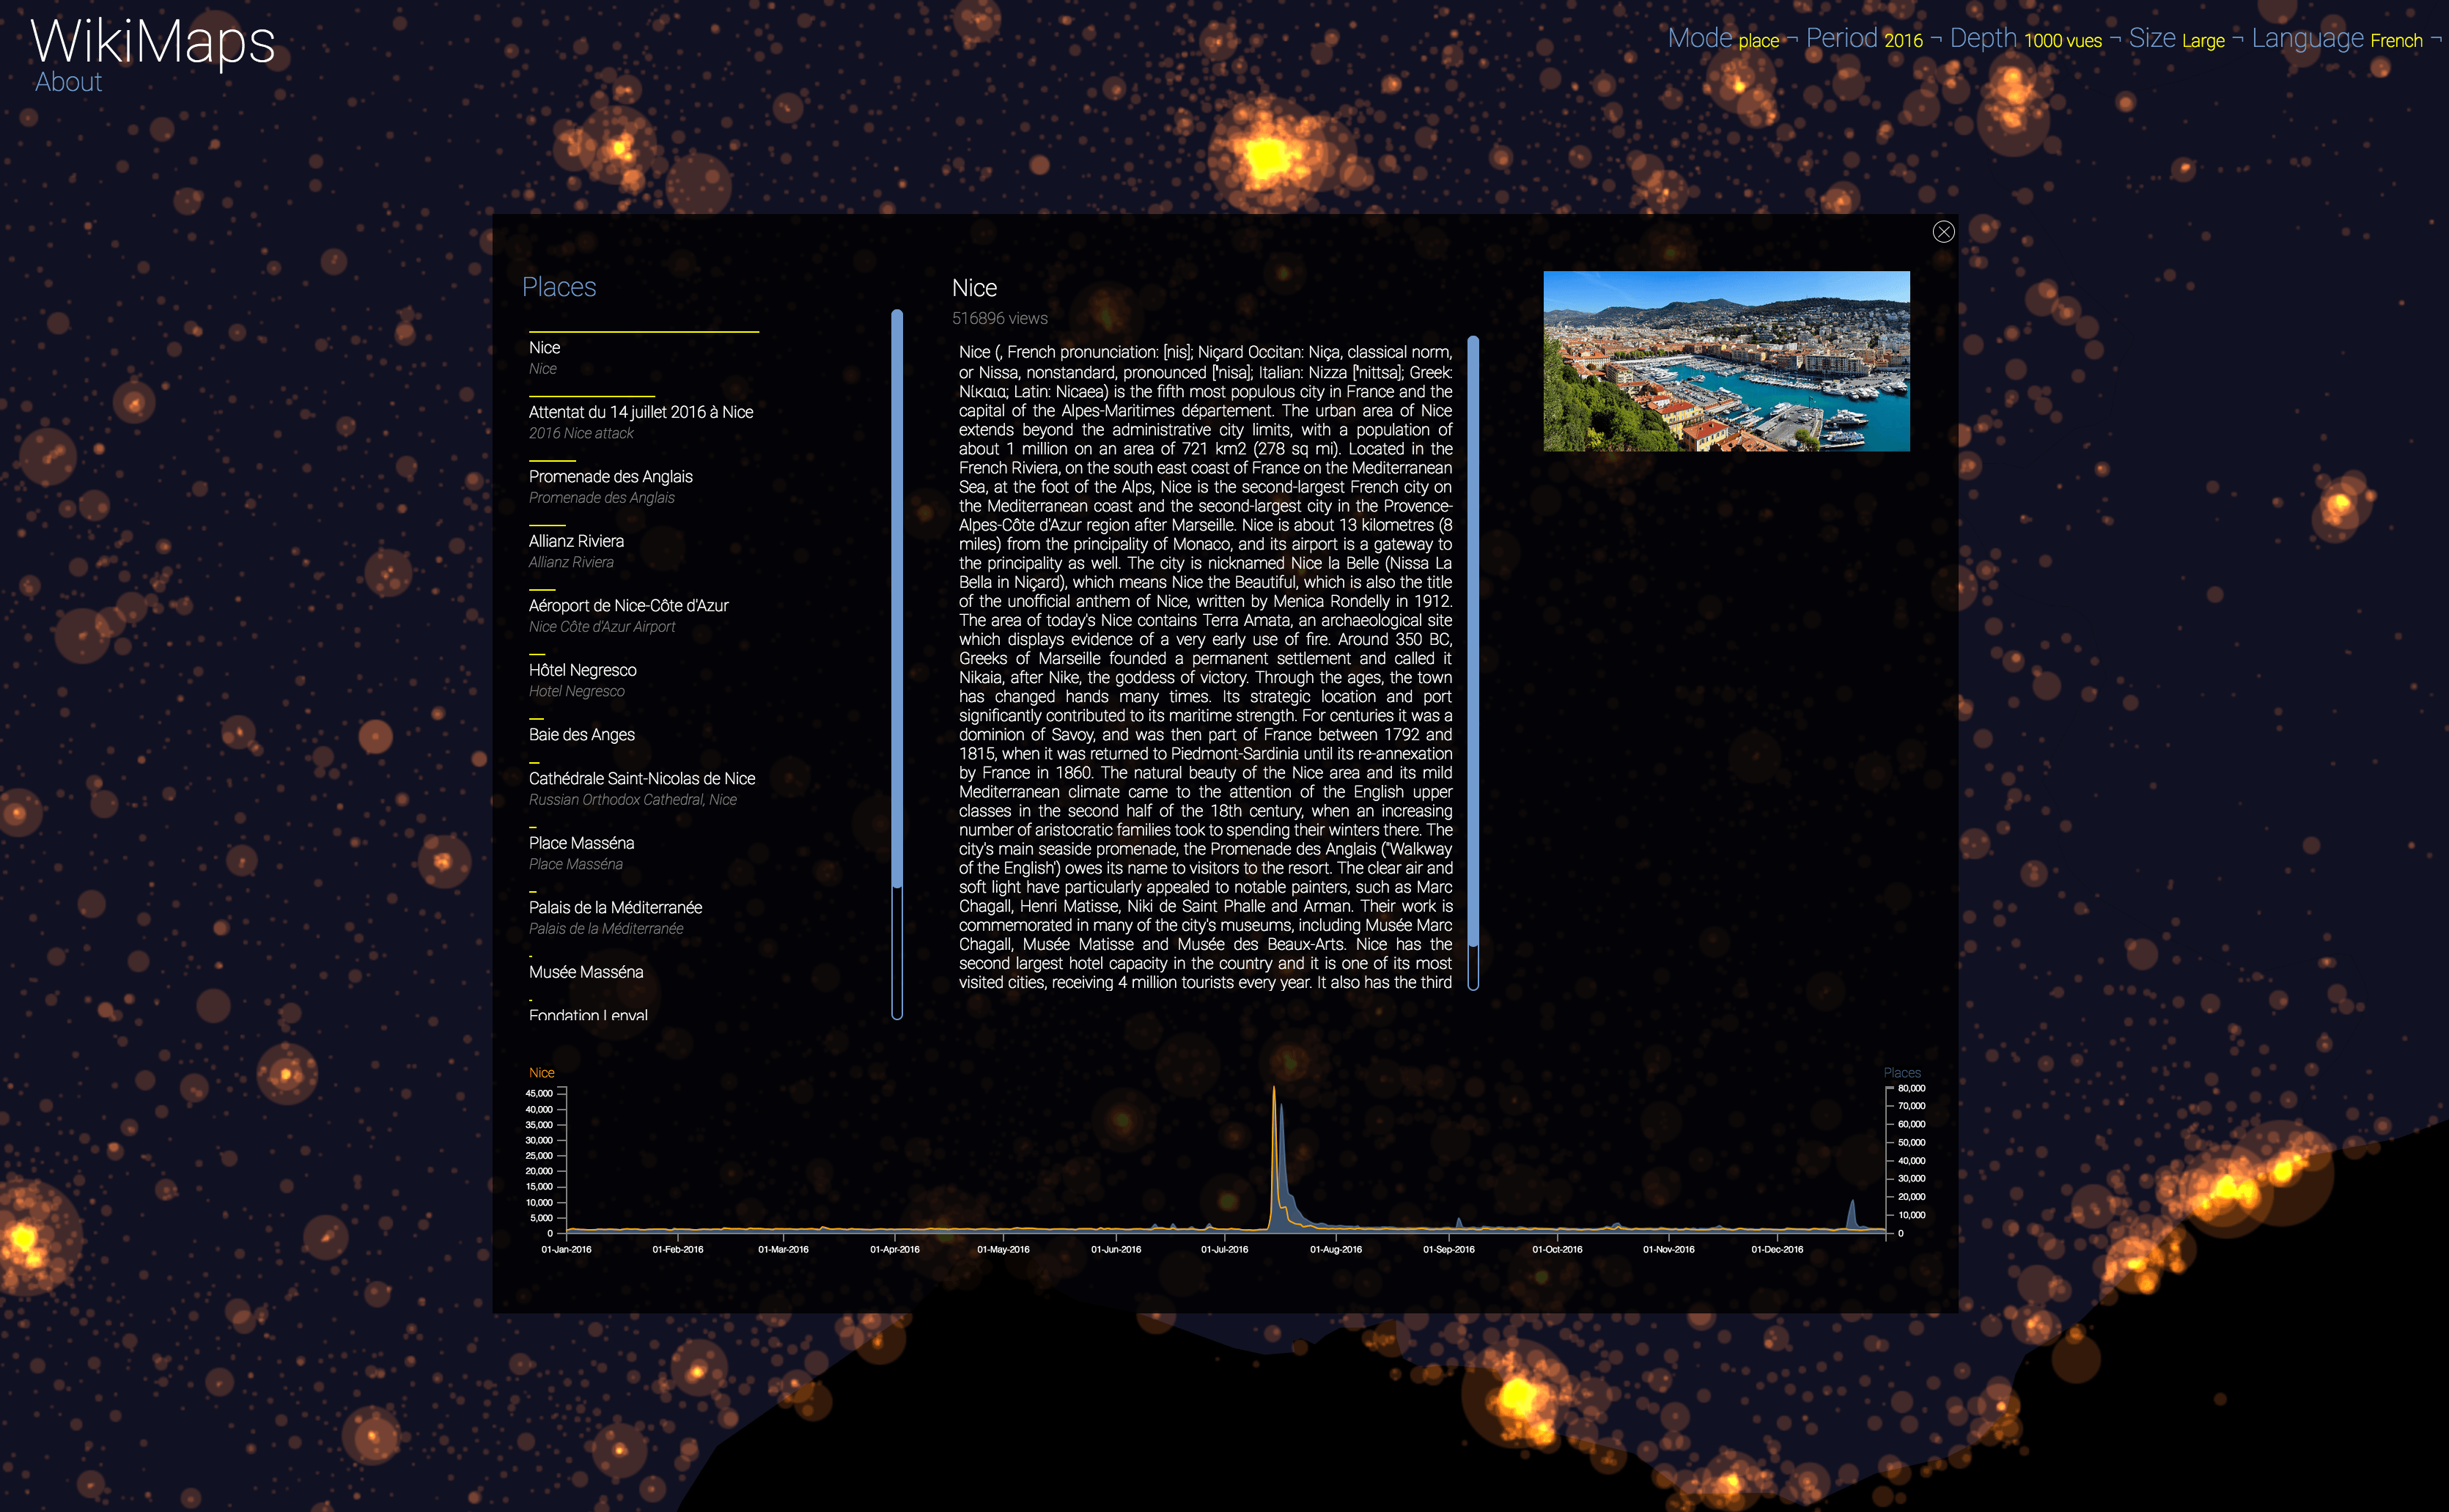
Nice - French - 2016
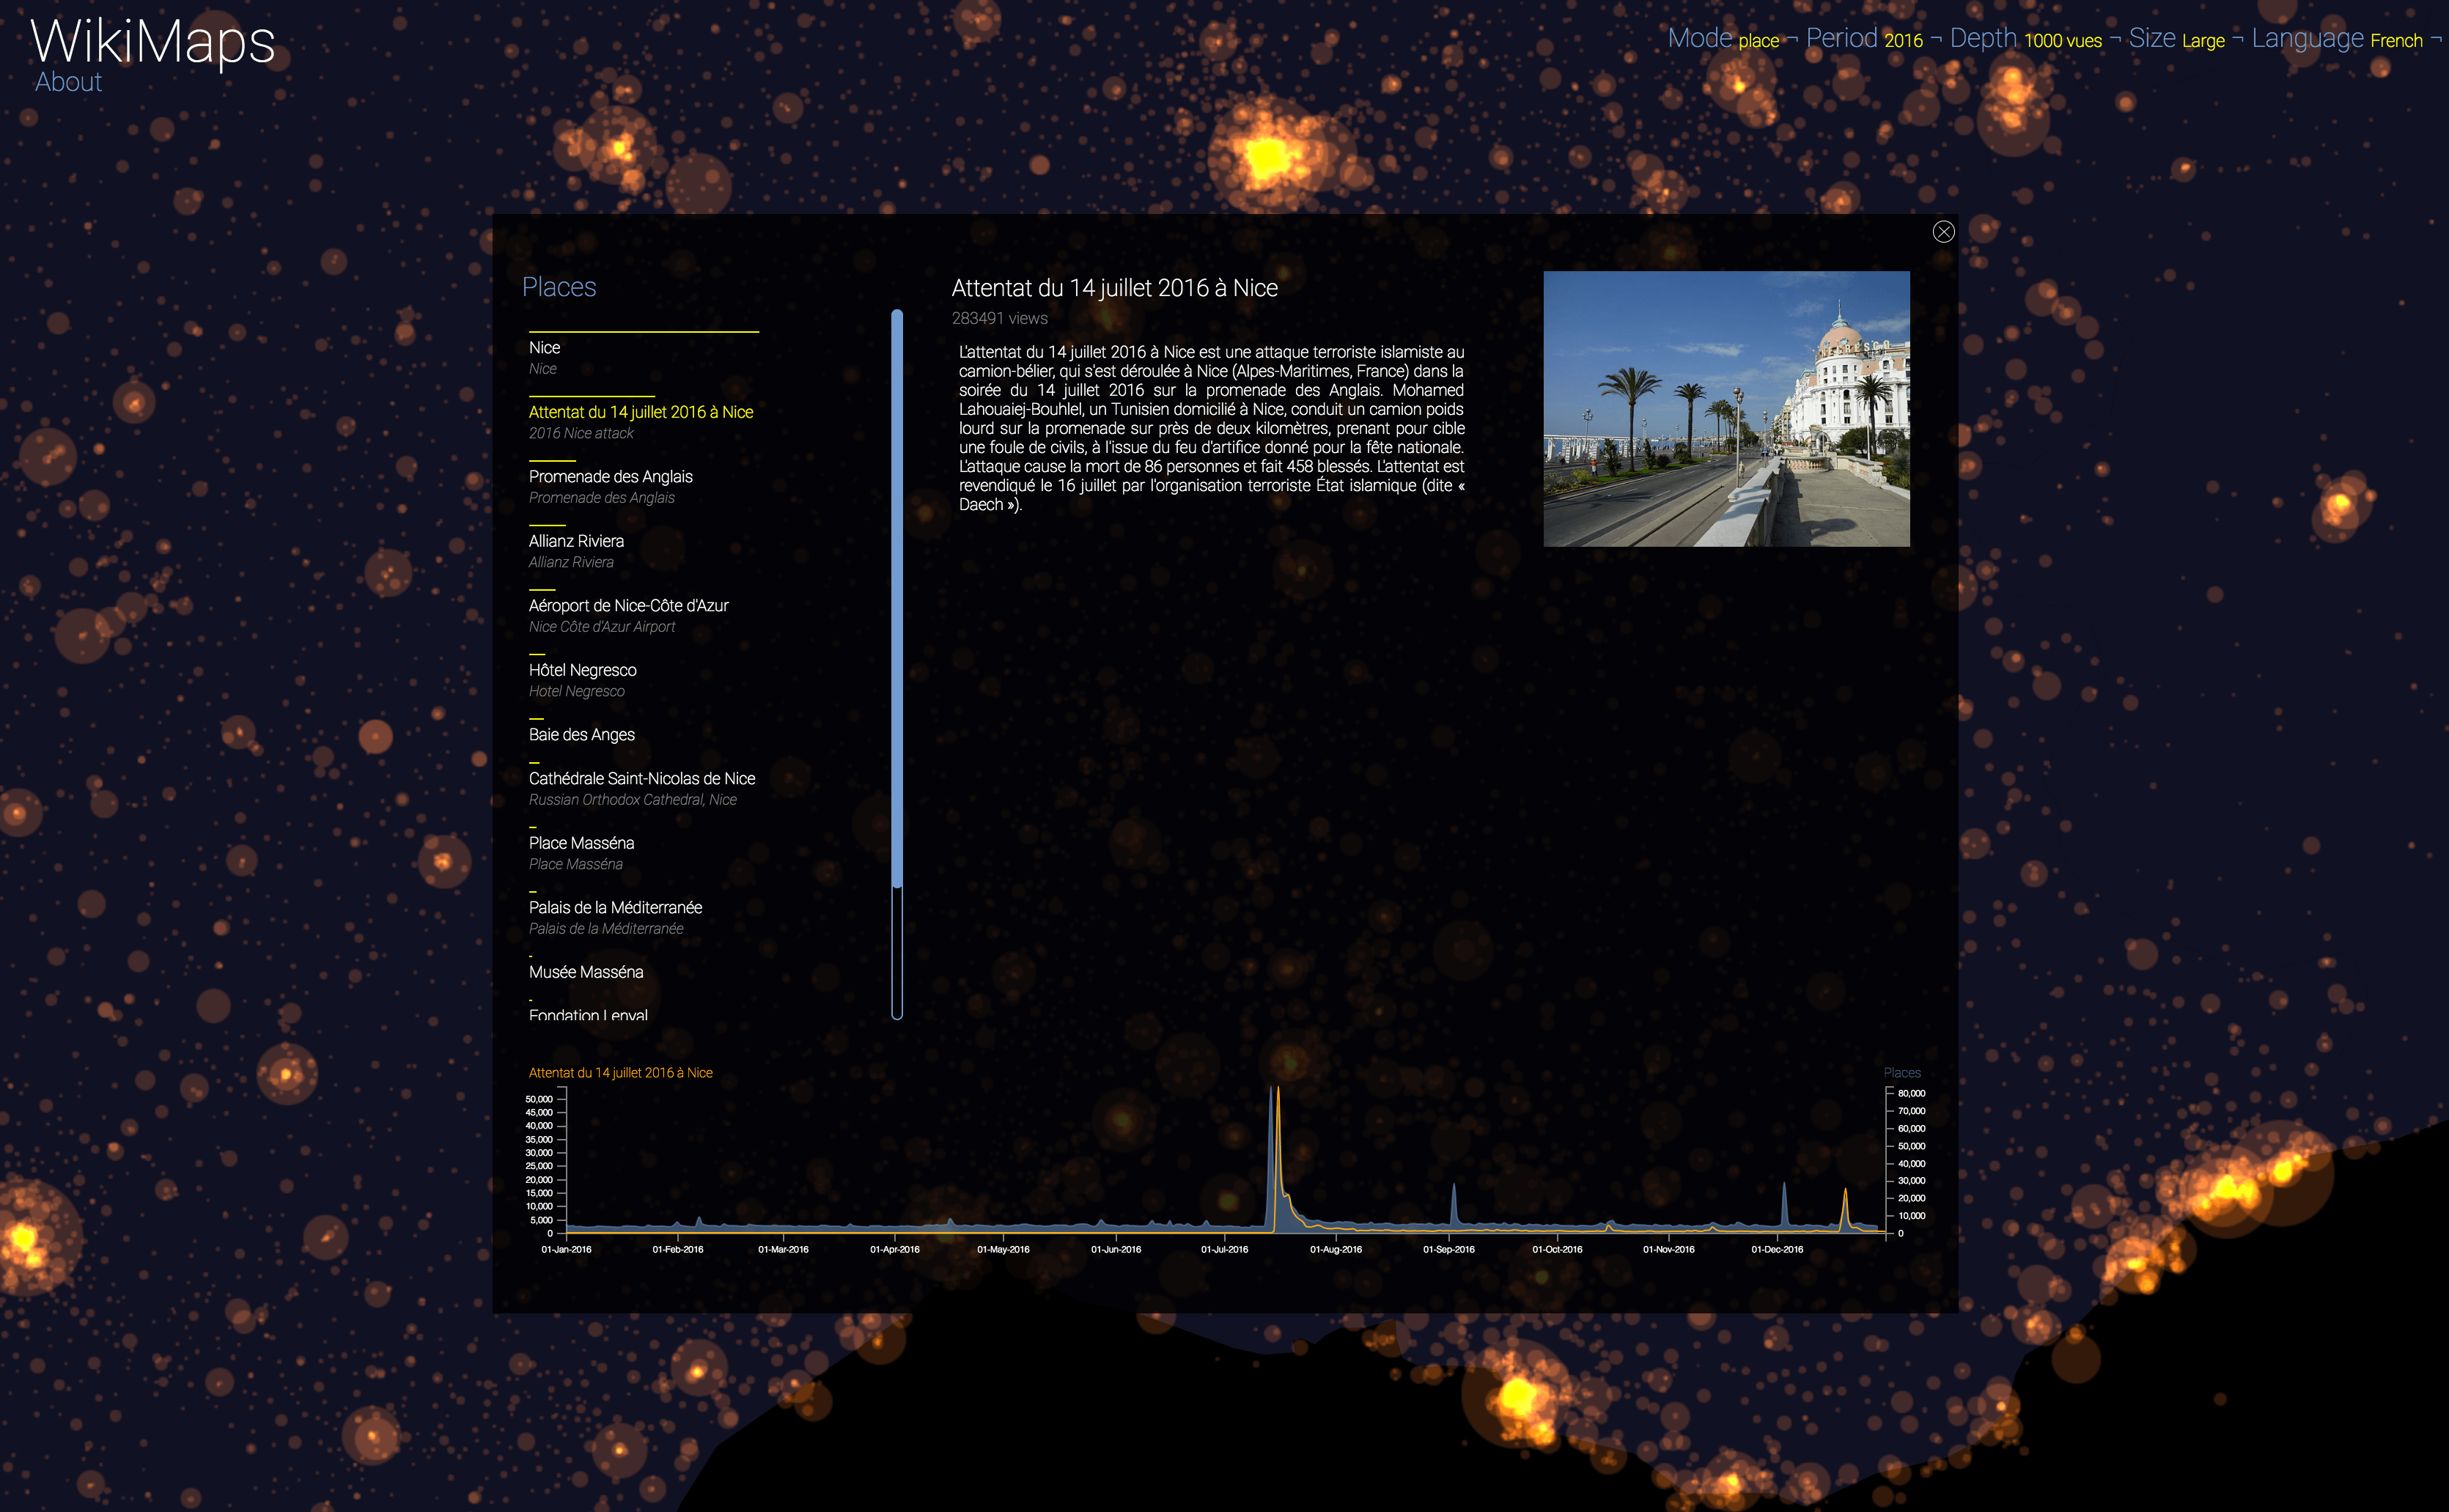
Attentat du 14 juillet 2016 à Nice - 2016
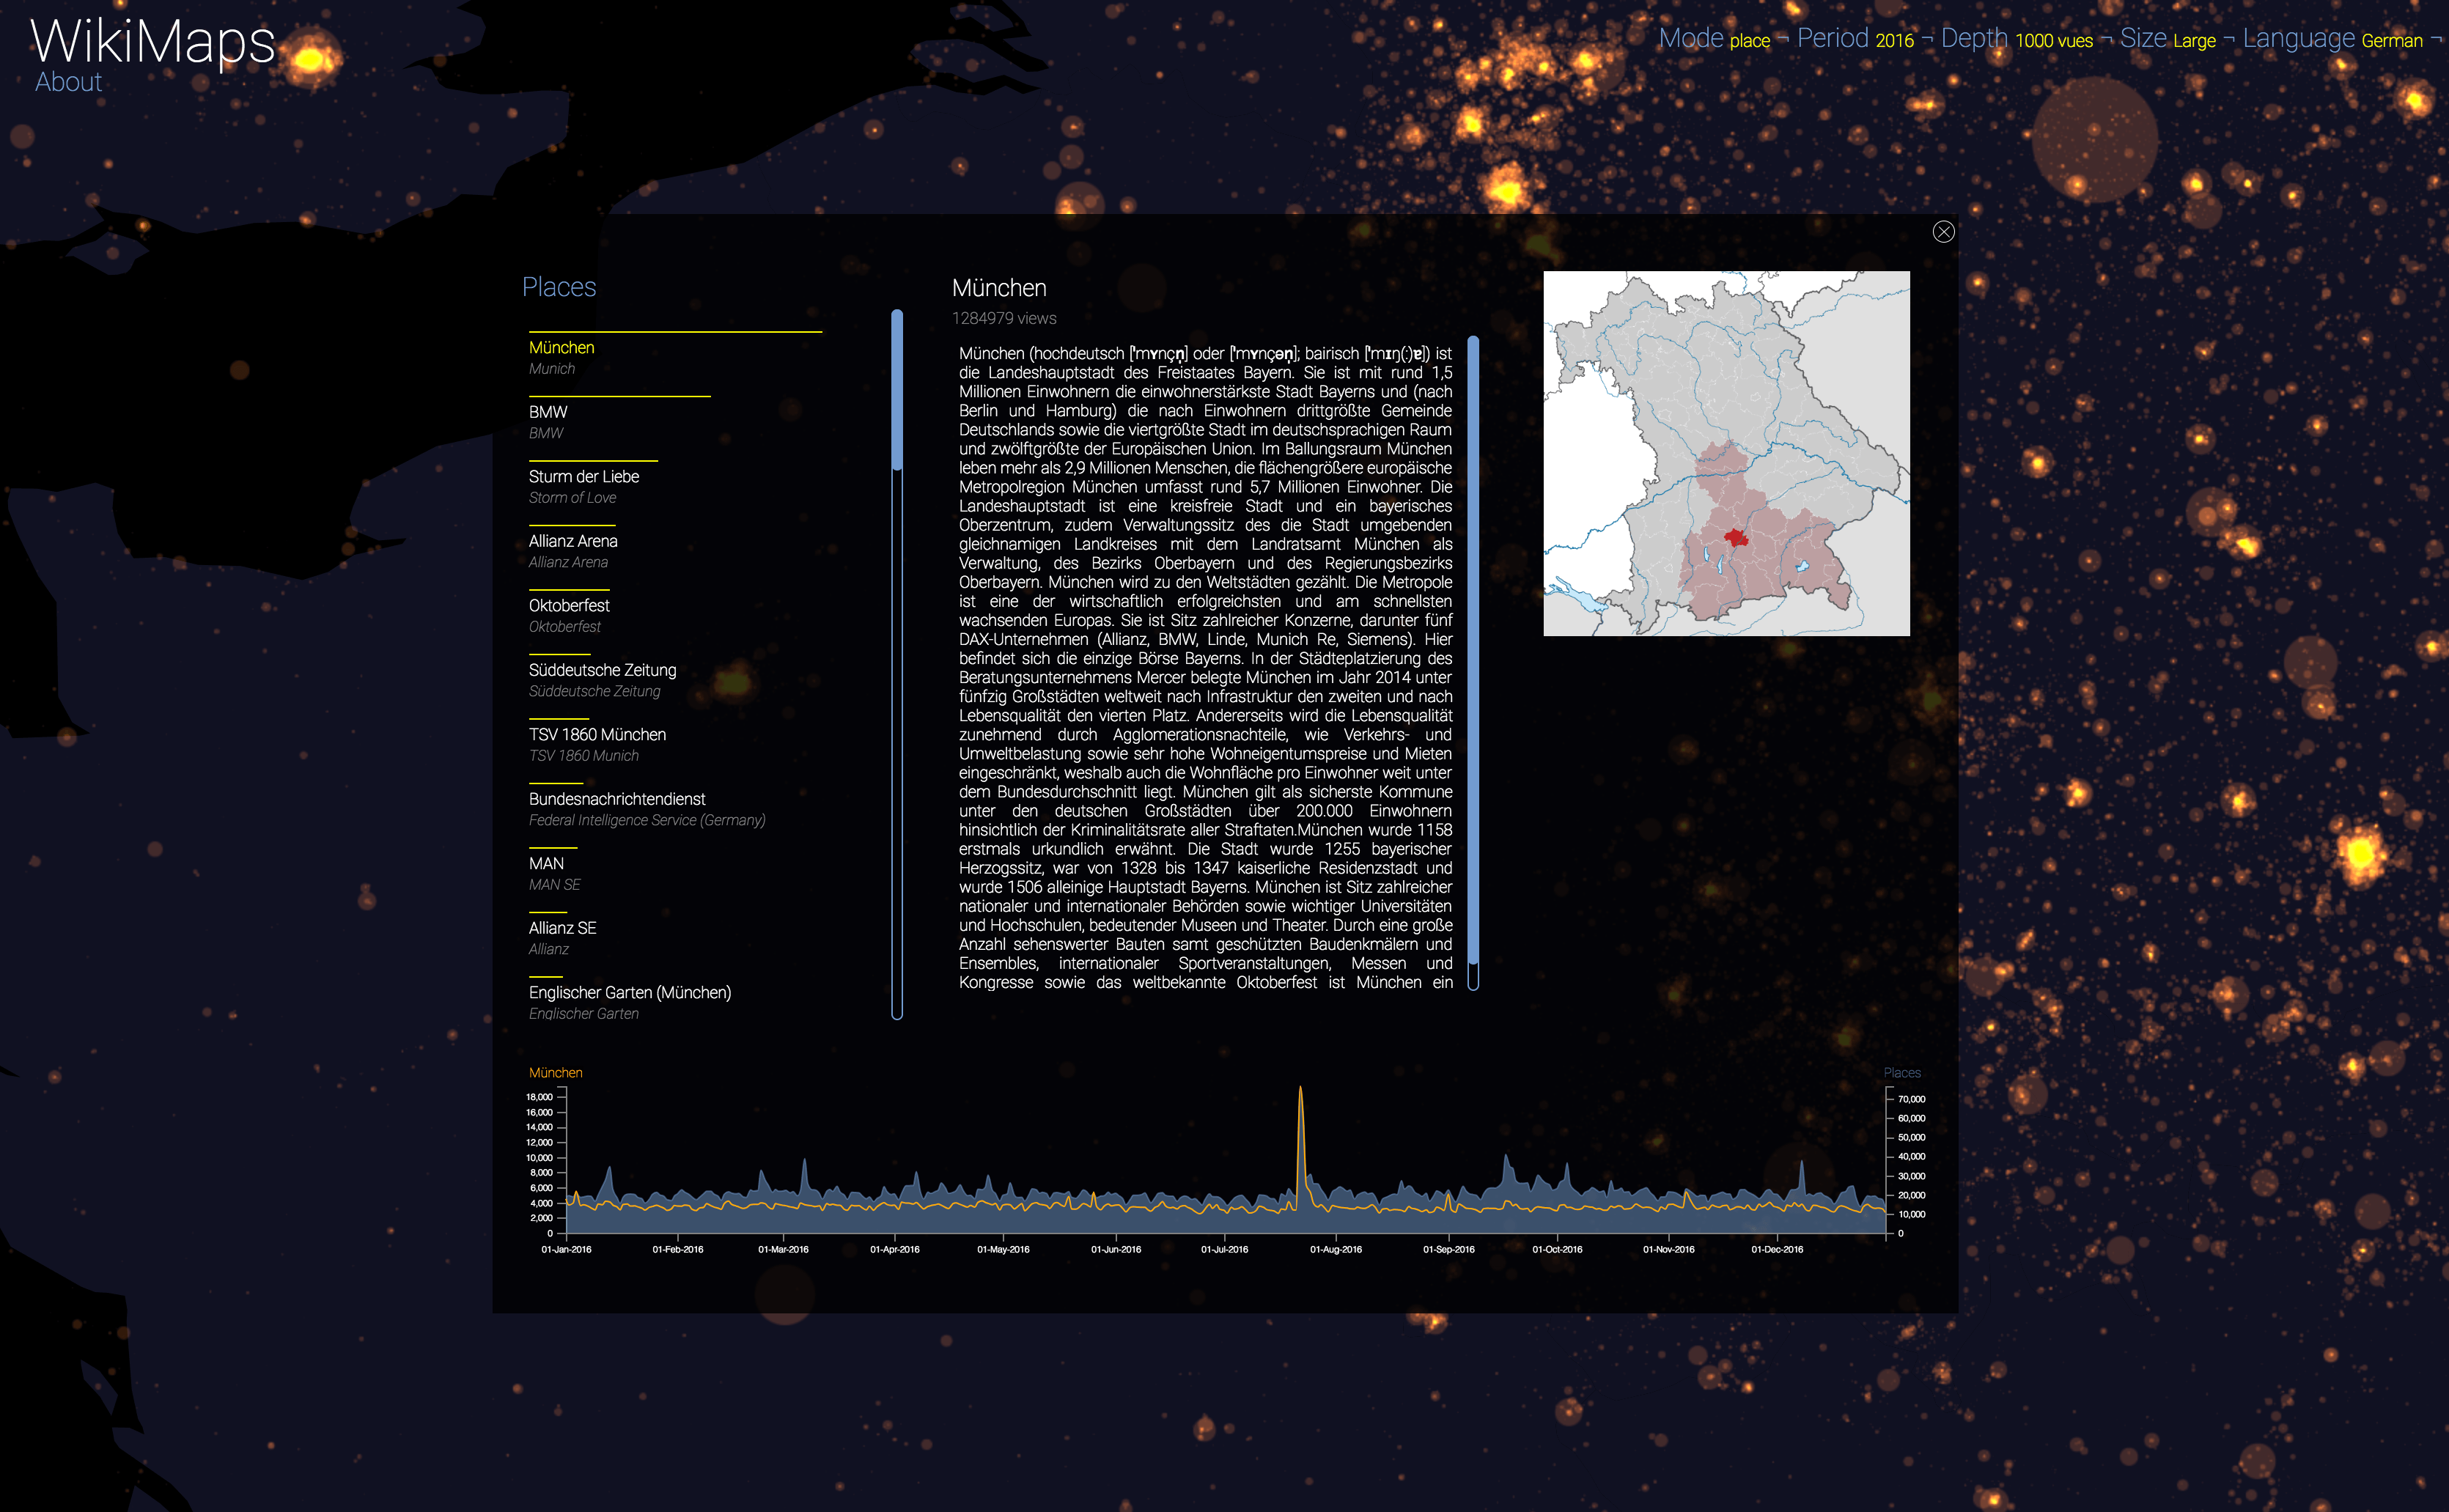
München - German - 2016
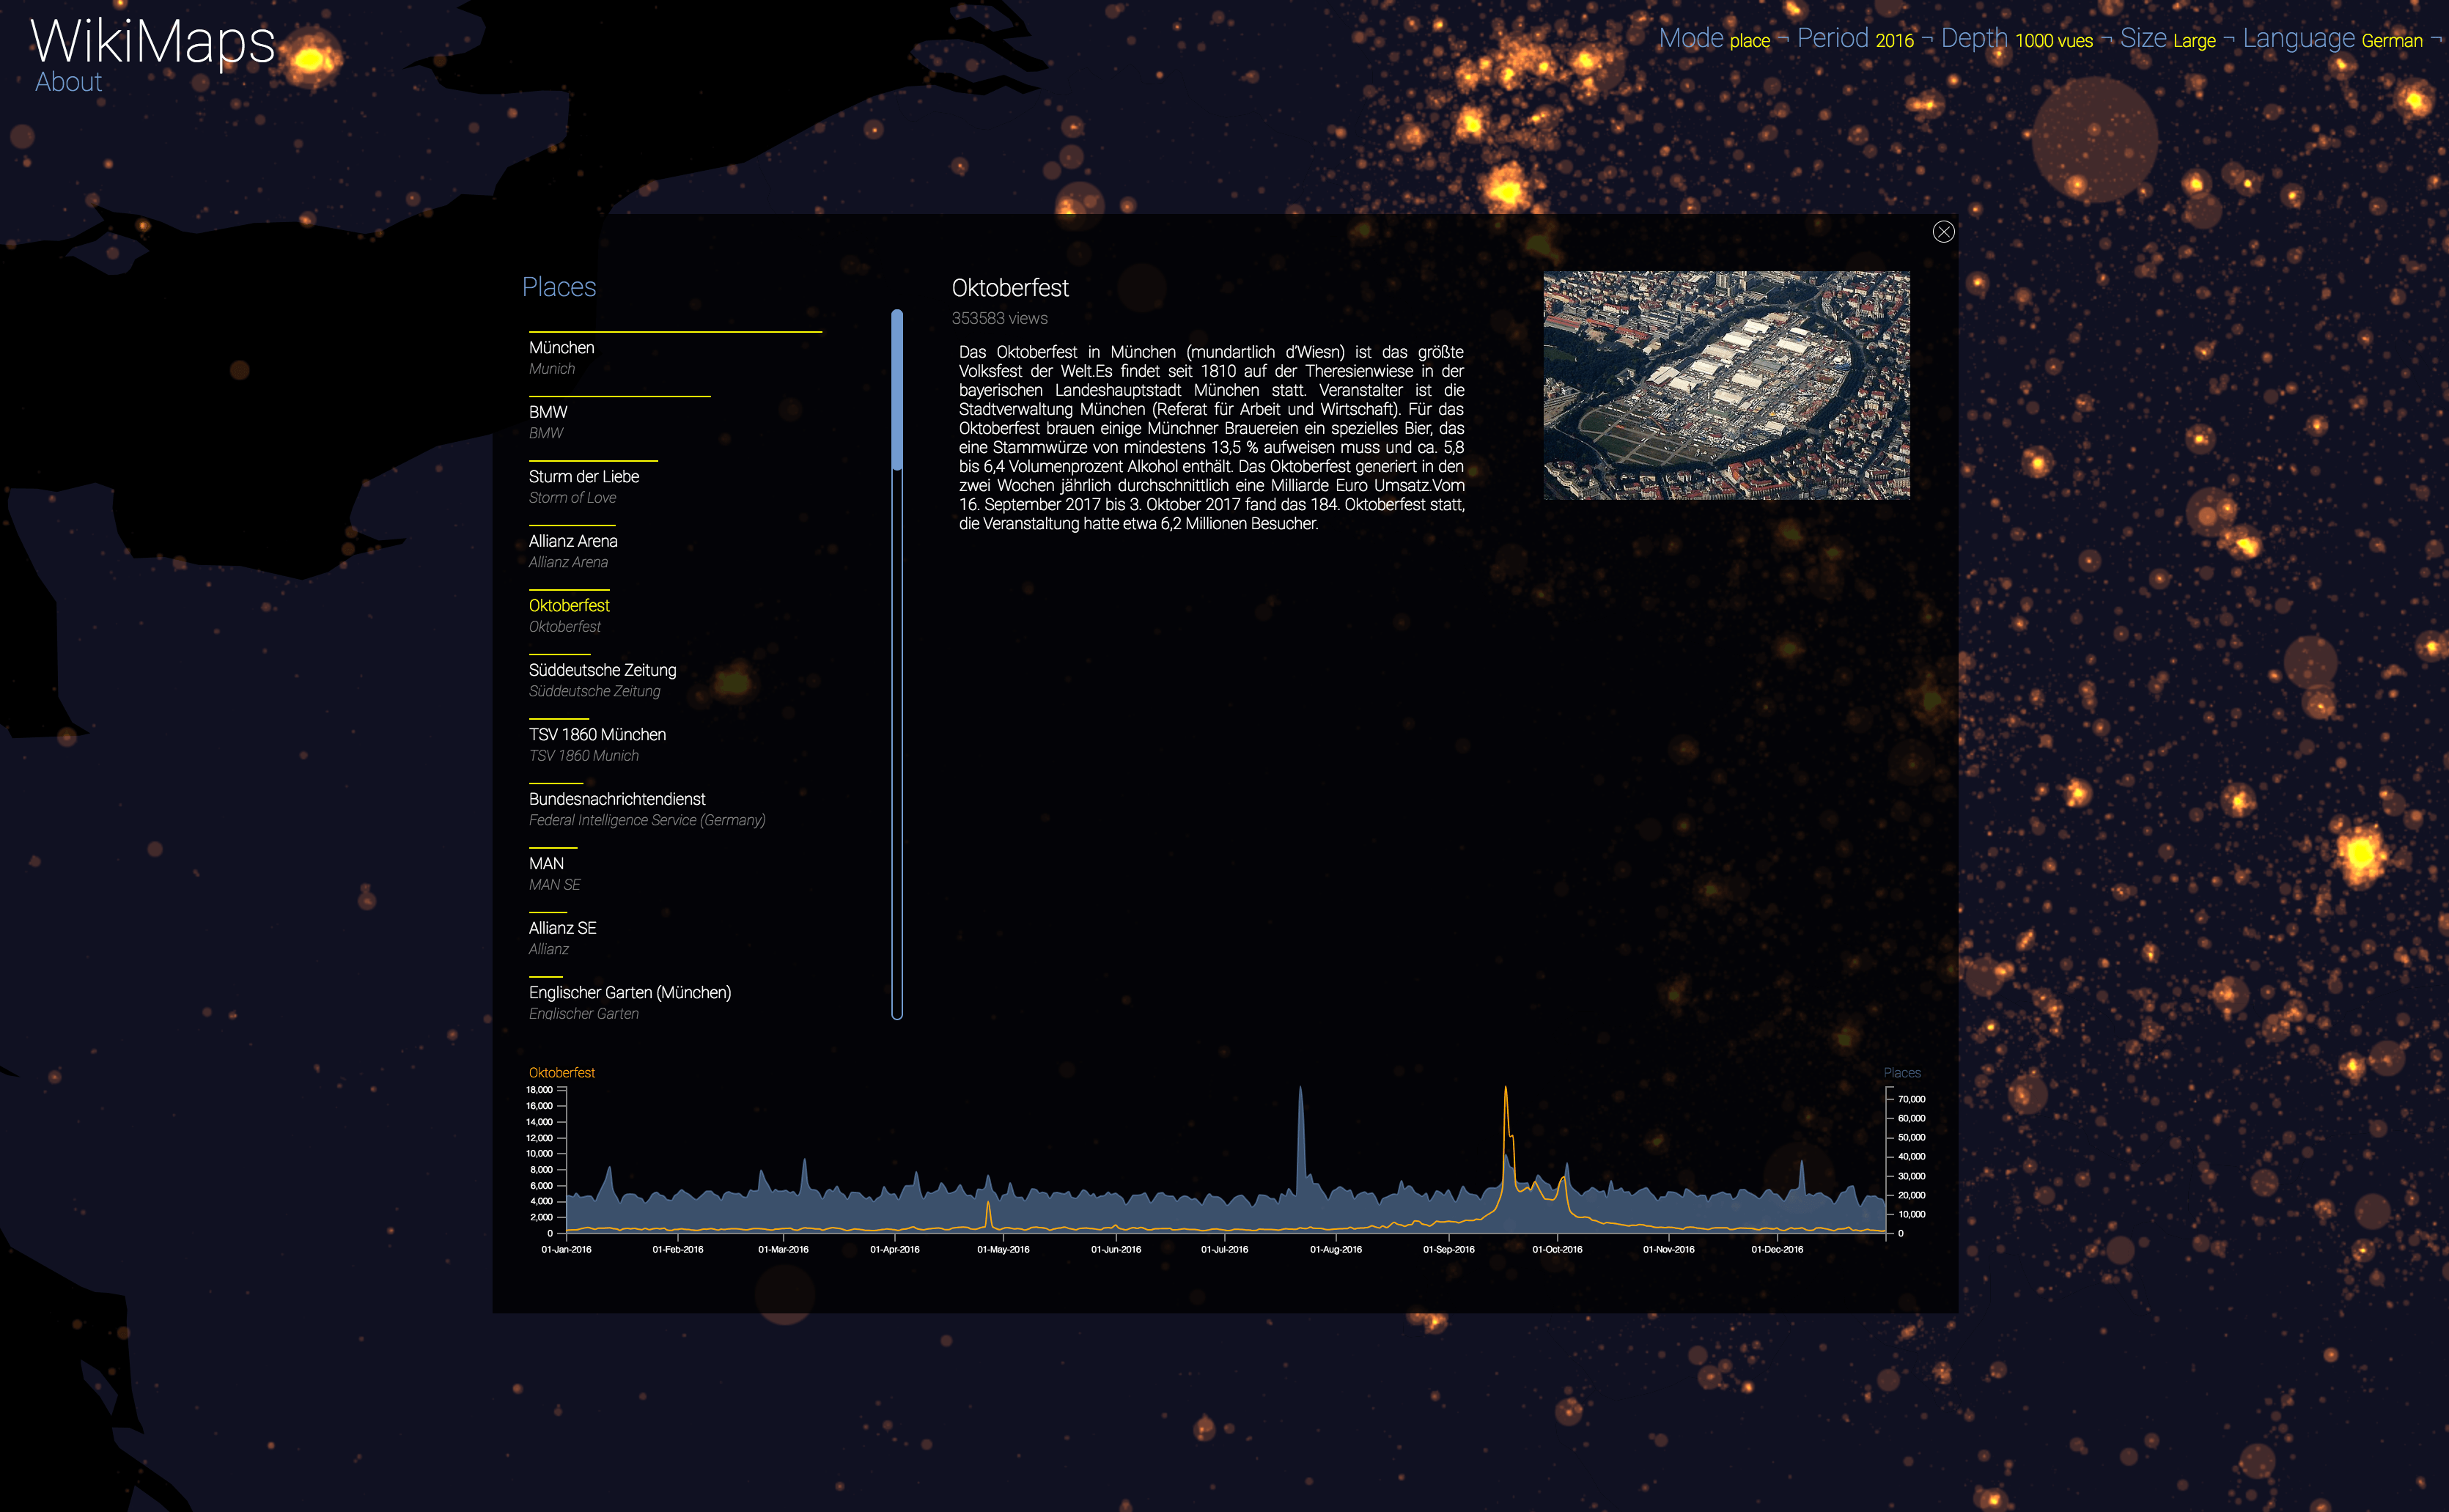
Oktoberfest - German - 2016
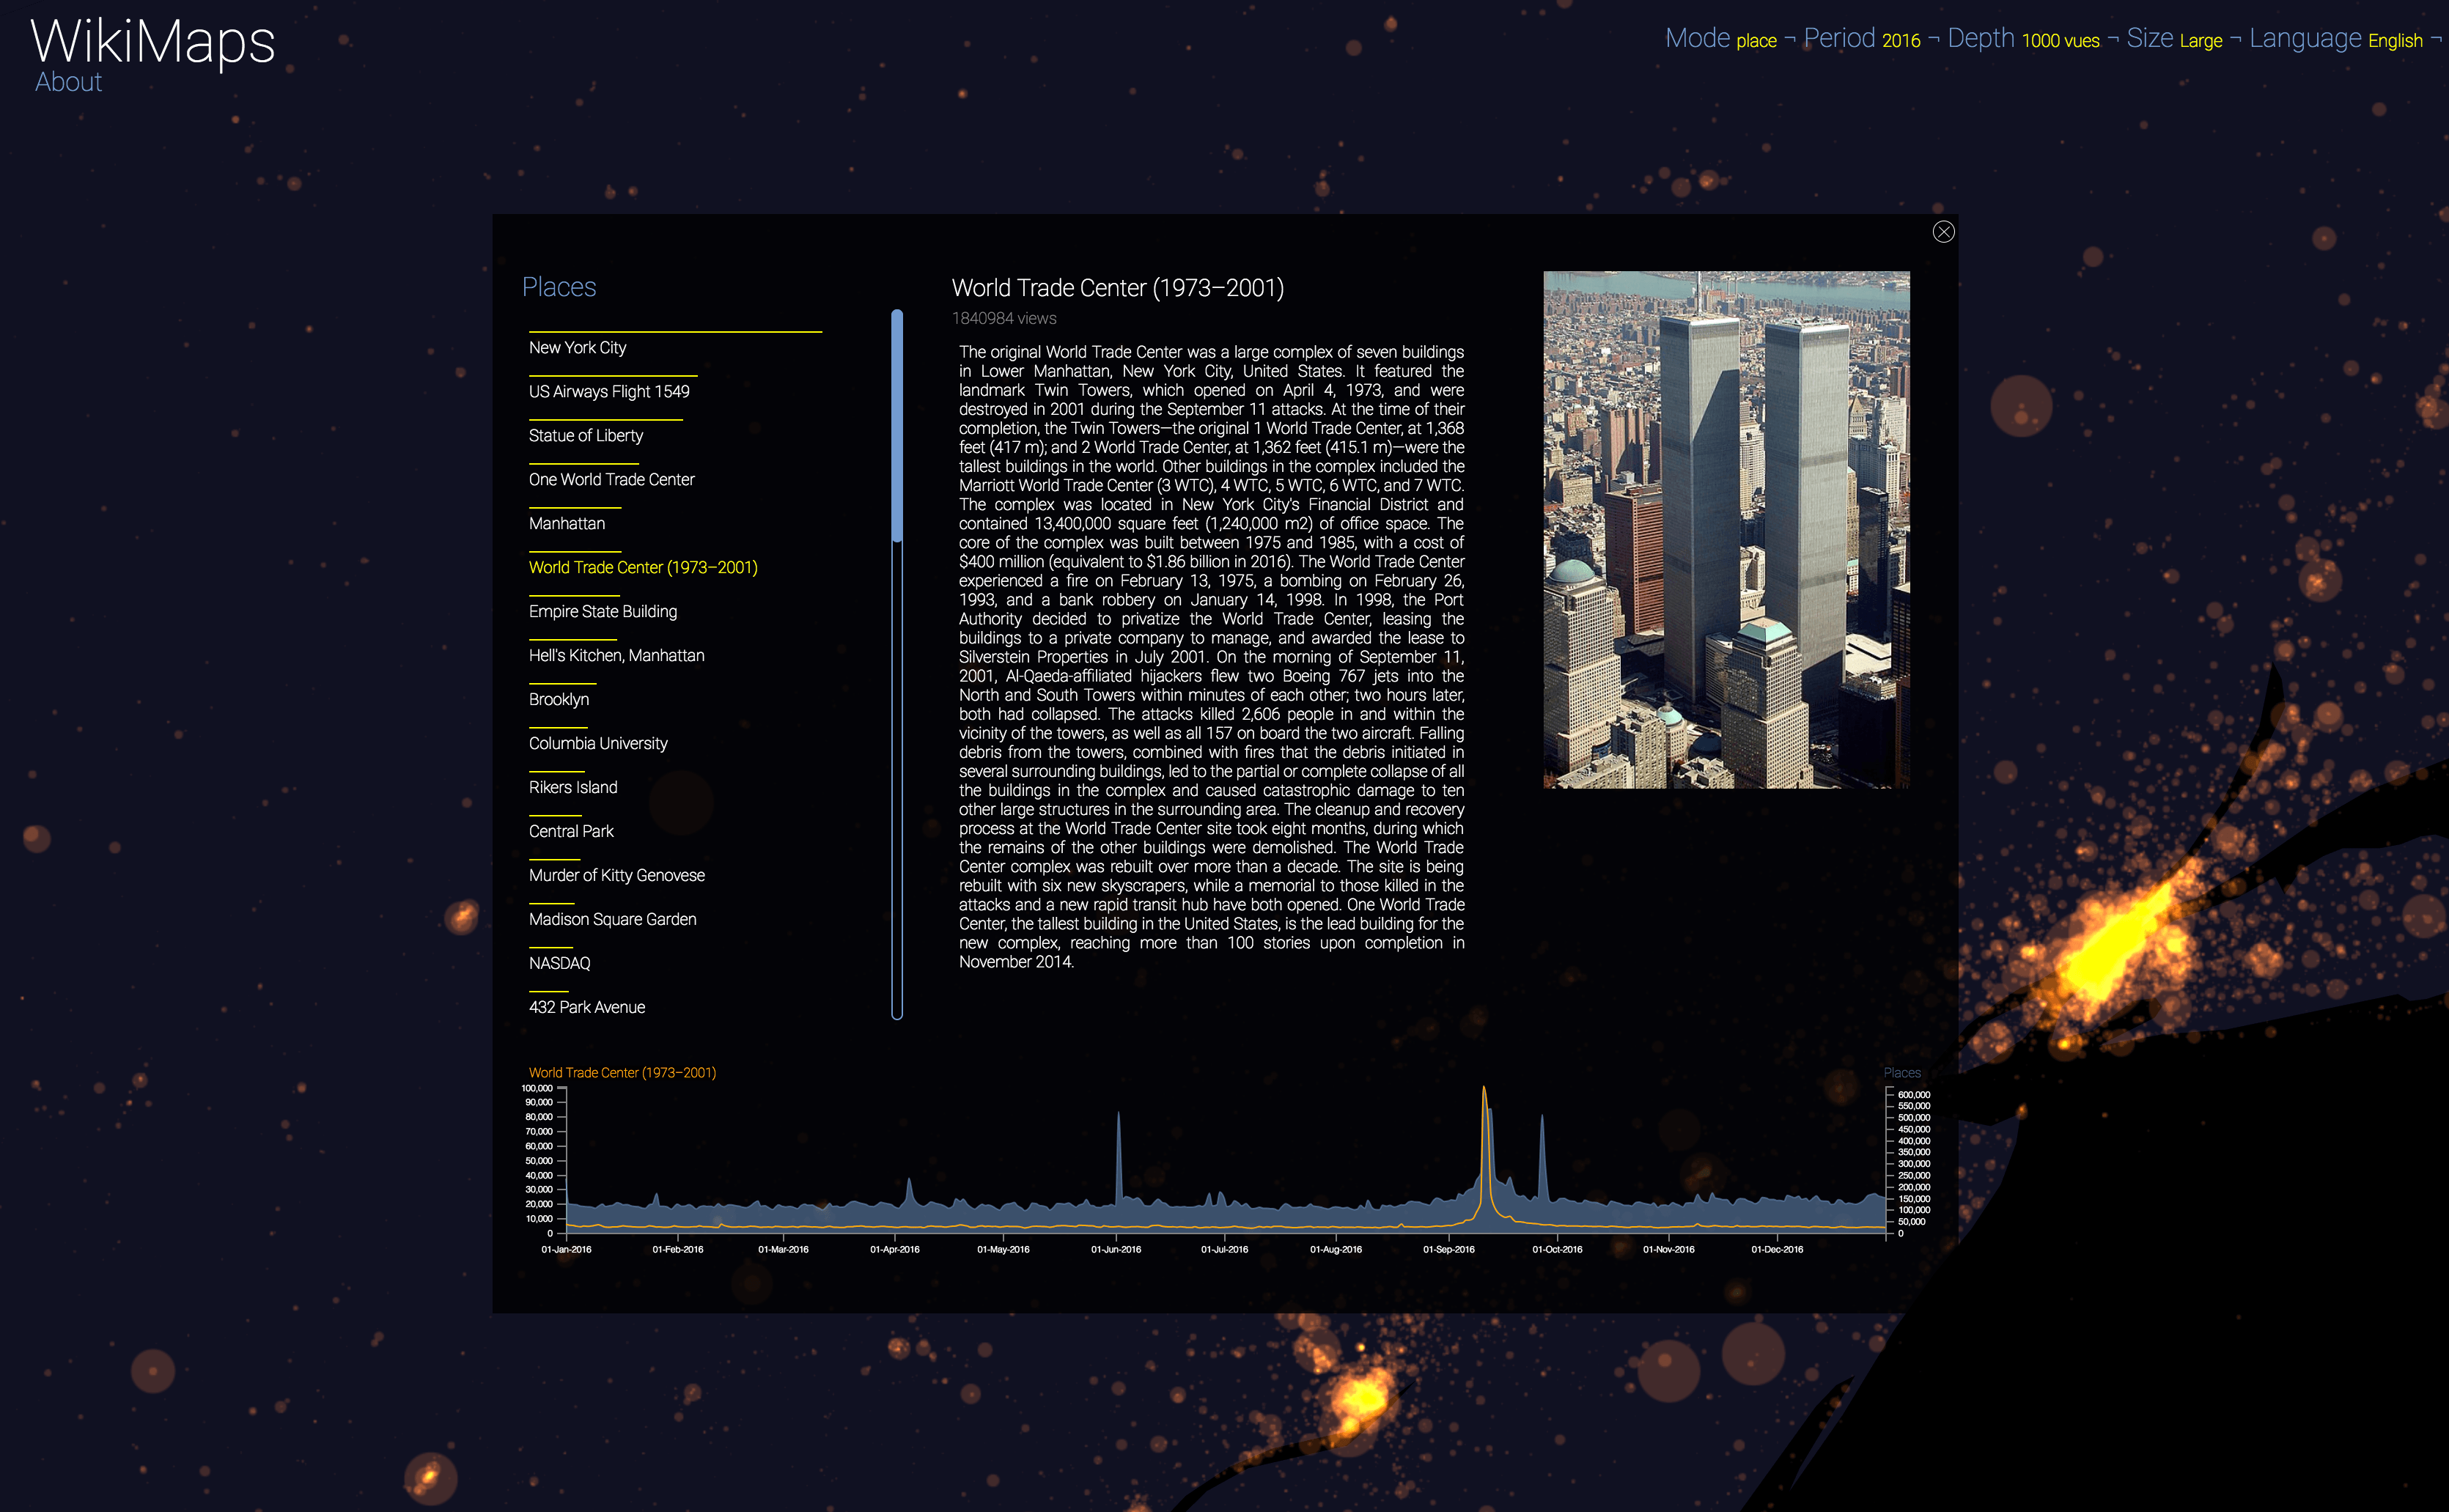
World Trade Center (1973-2001) - English - 2016
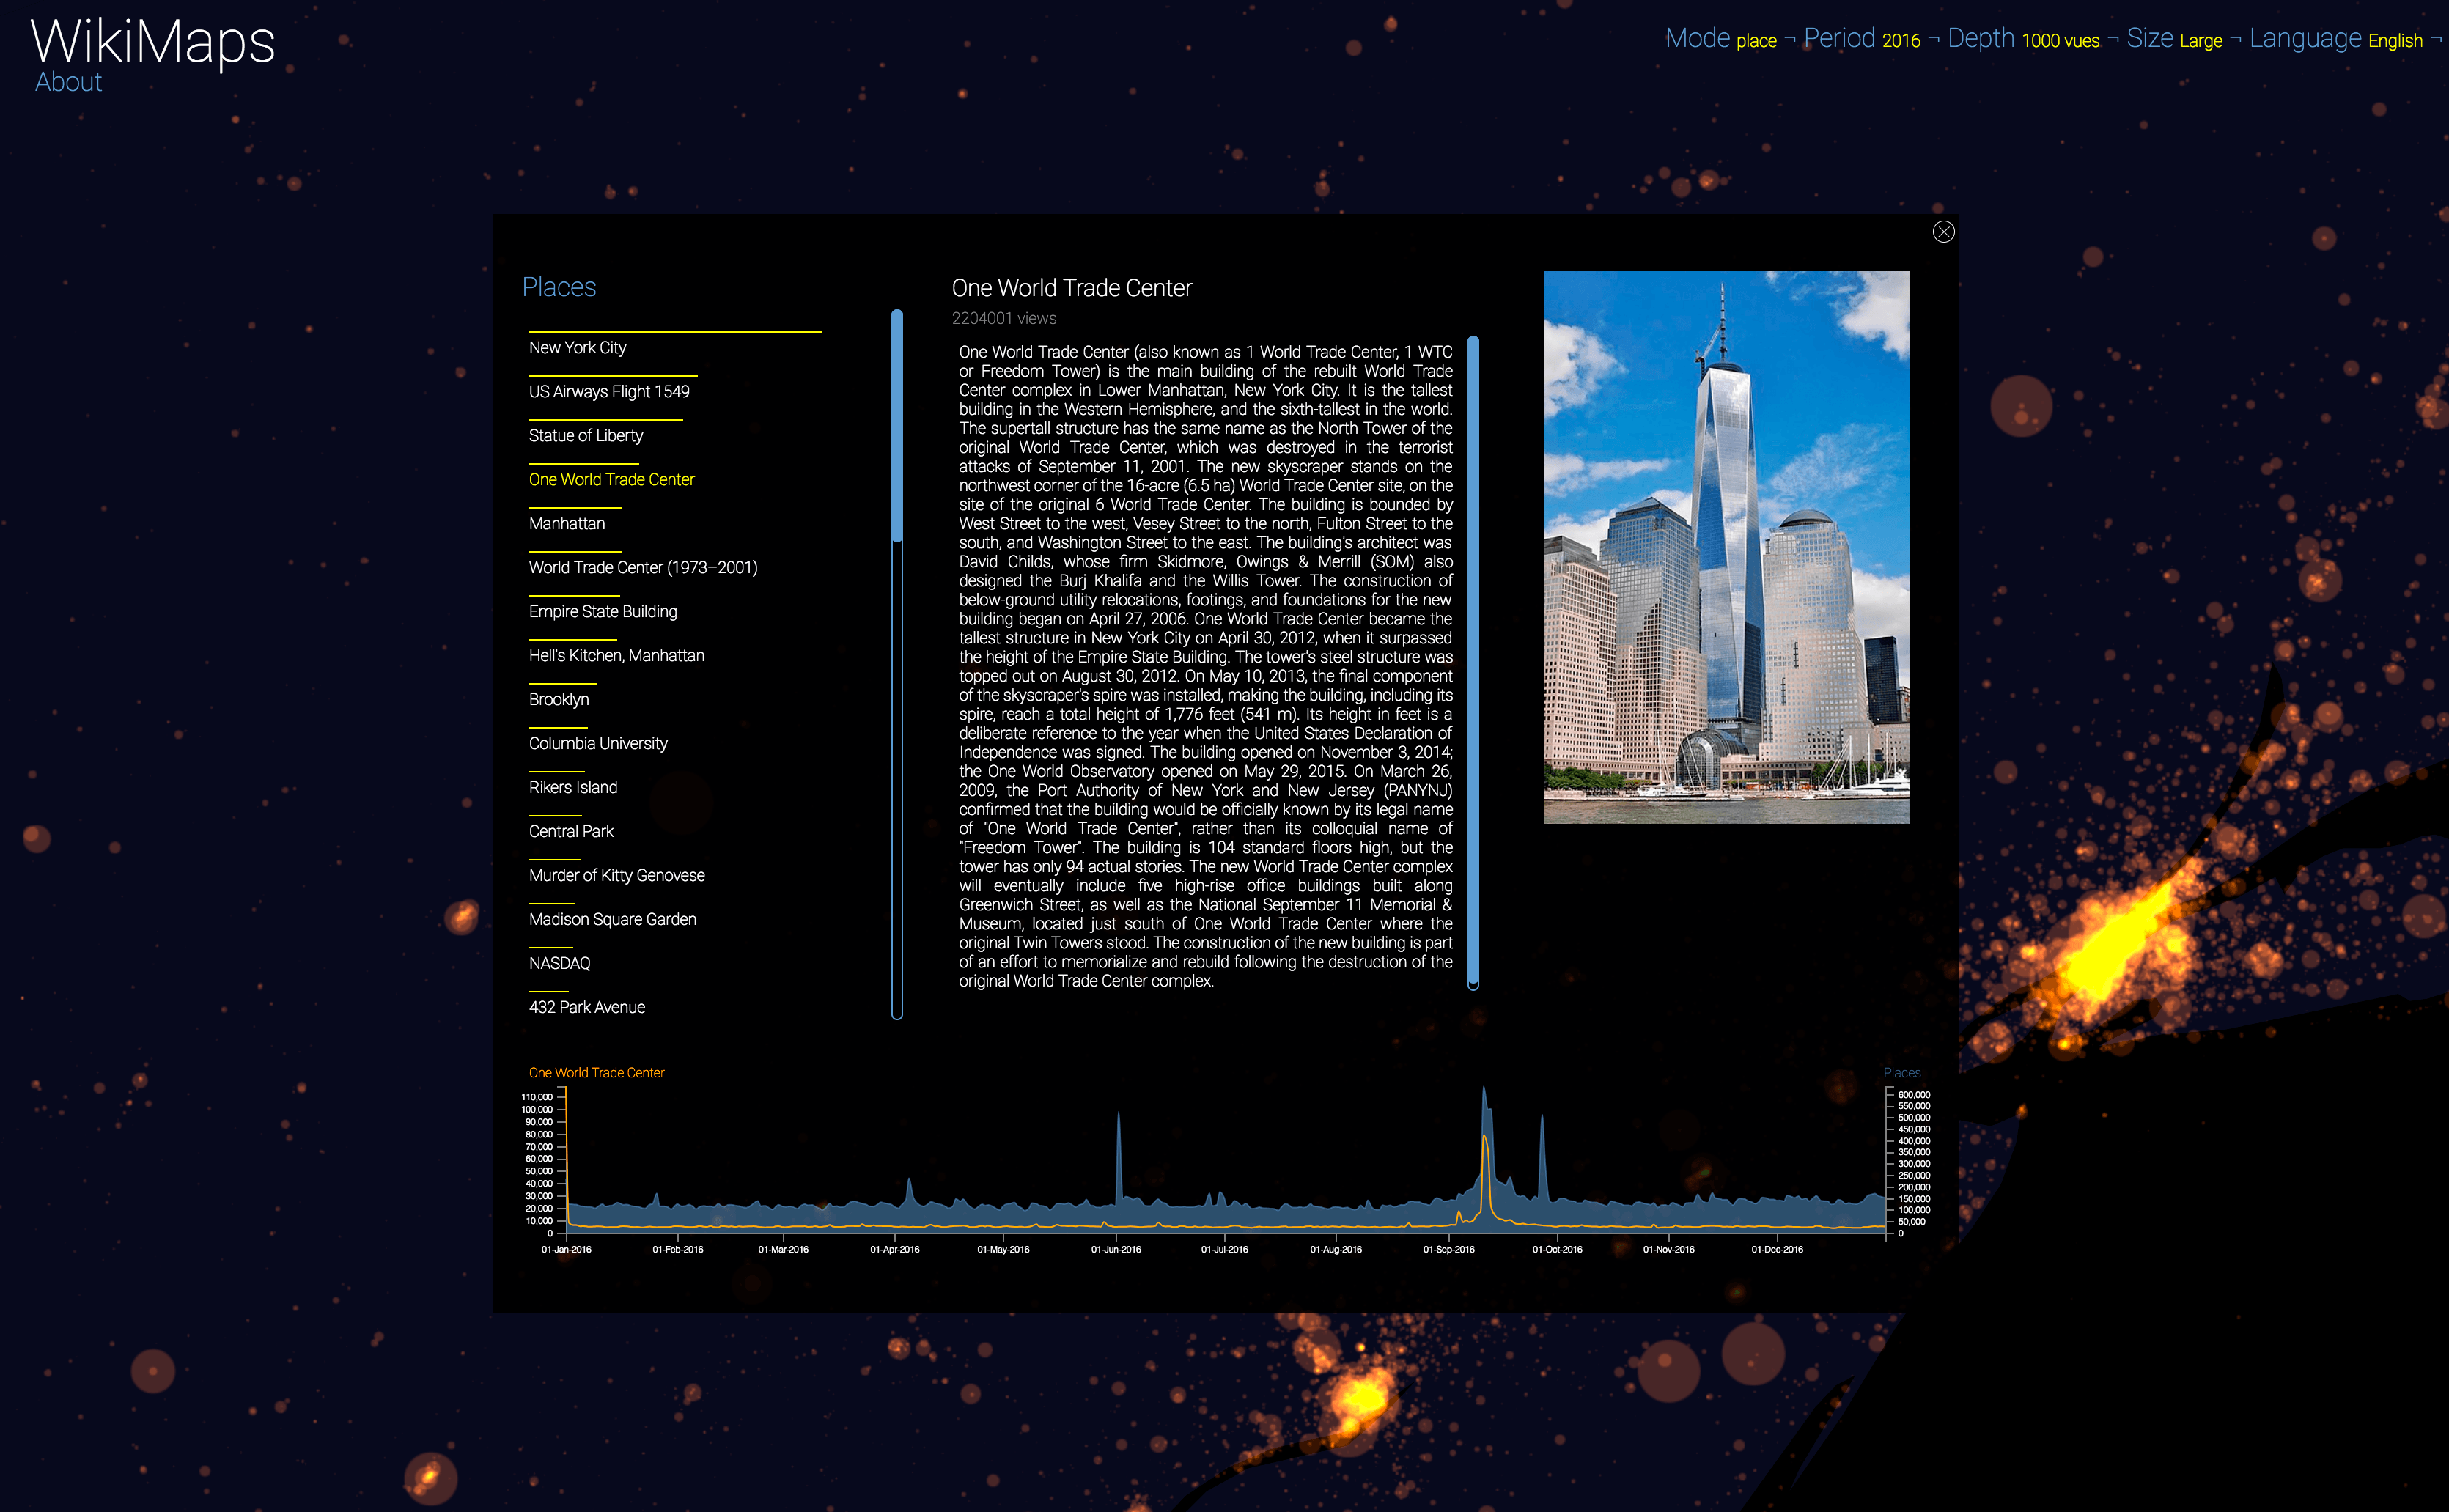
One World Trade Center - English - 2016
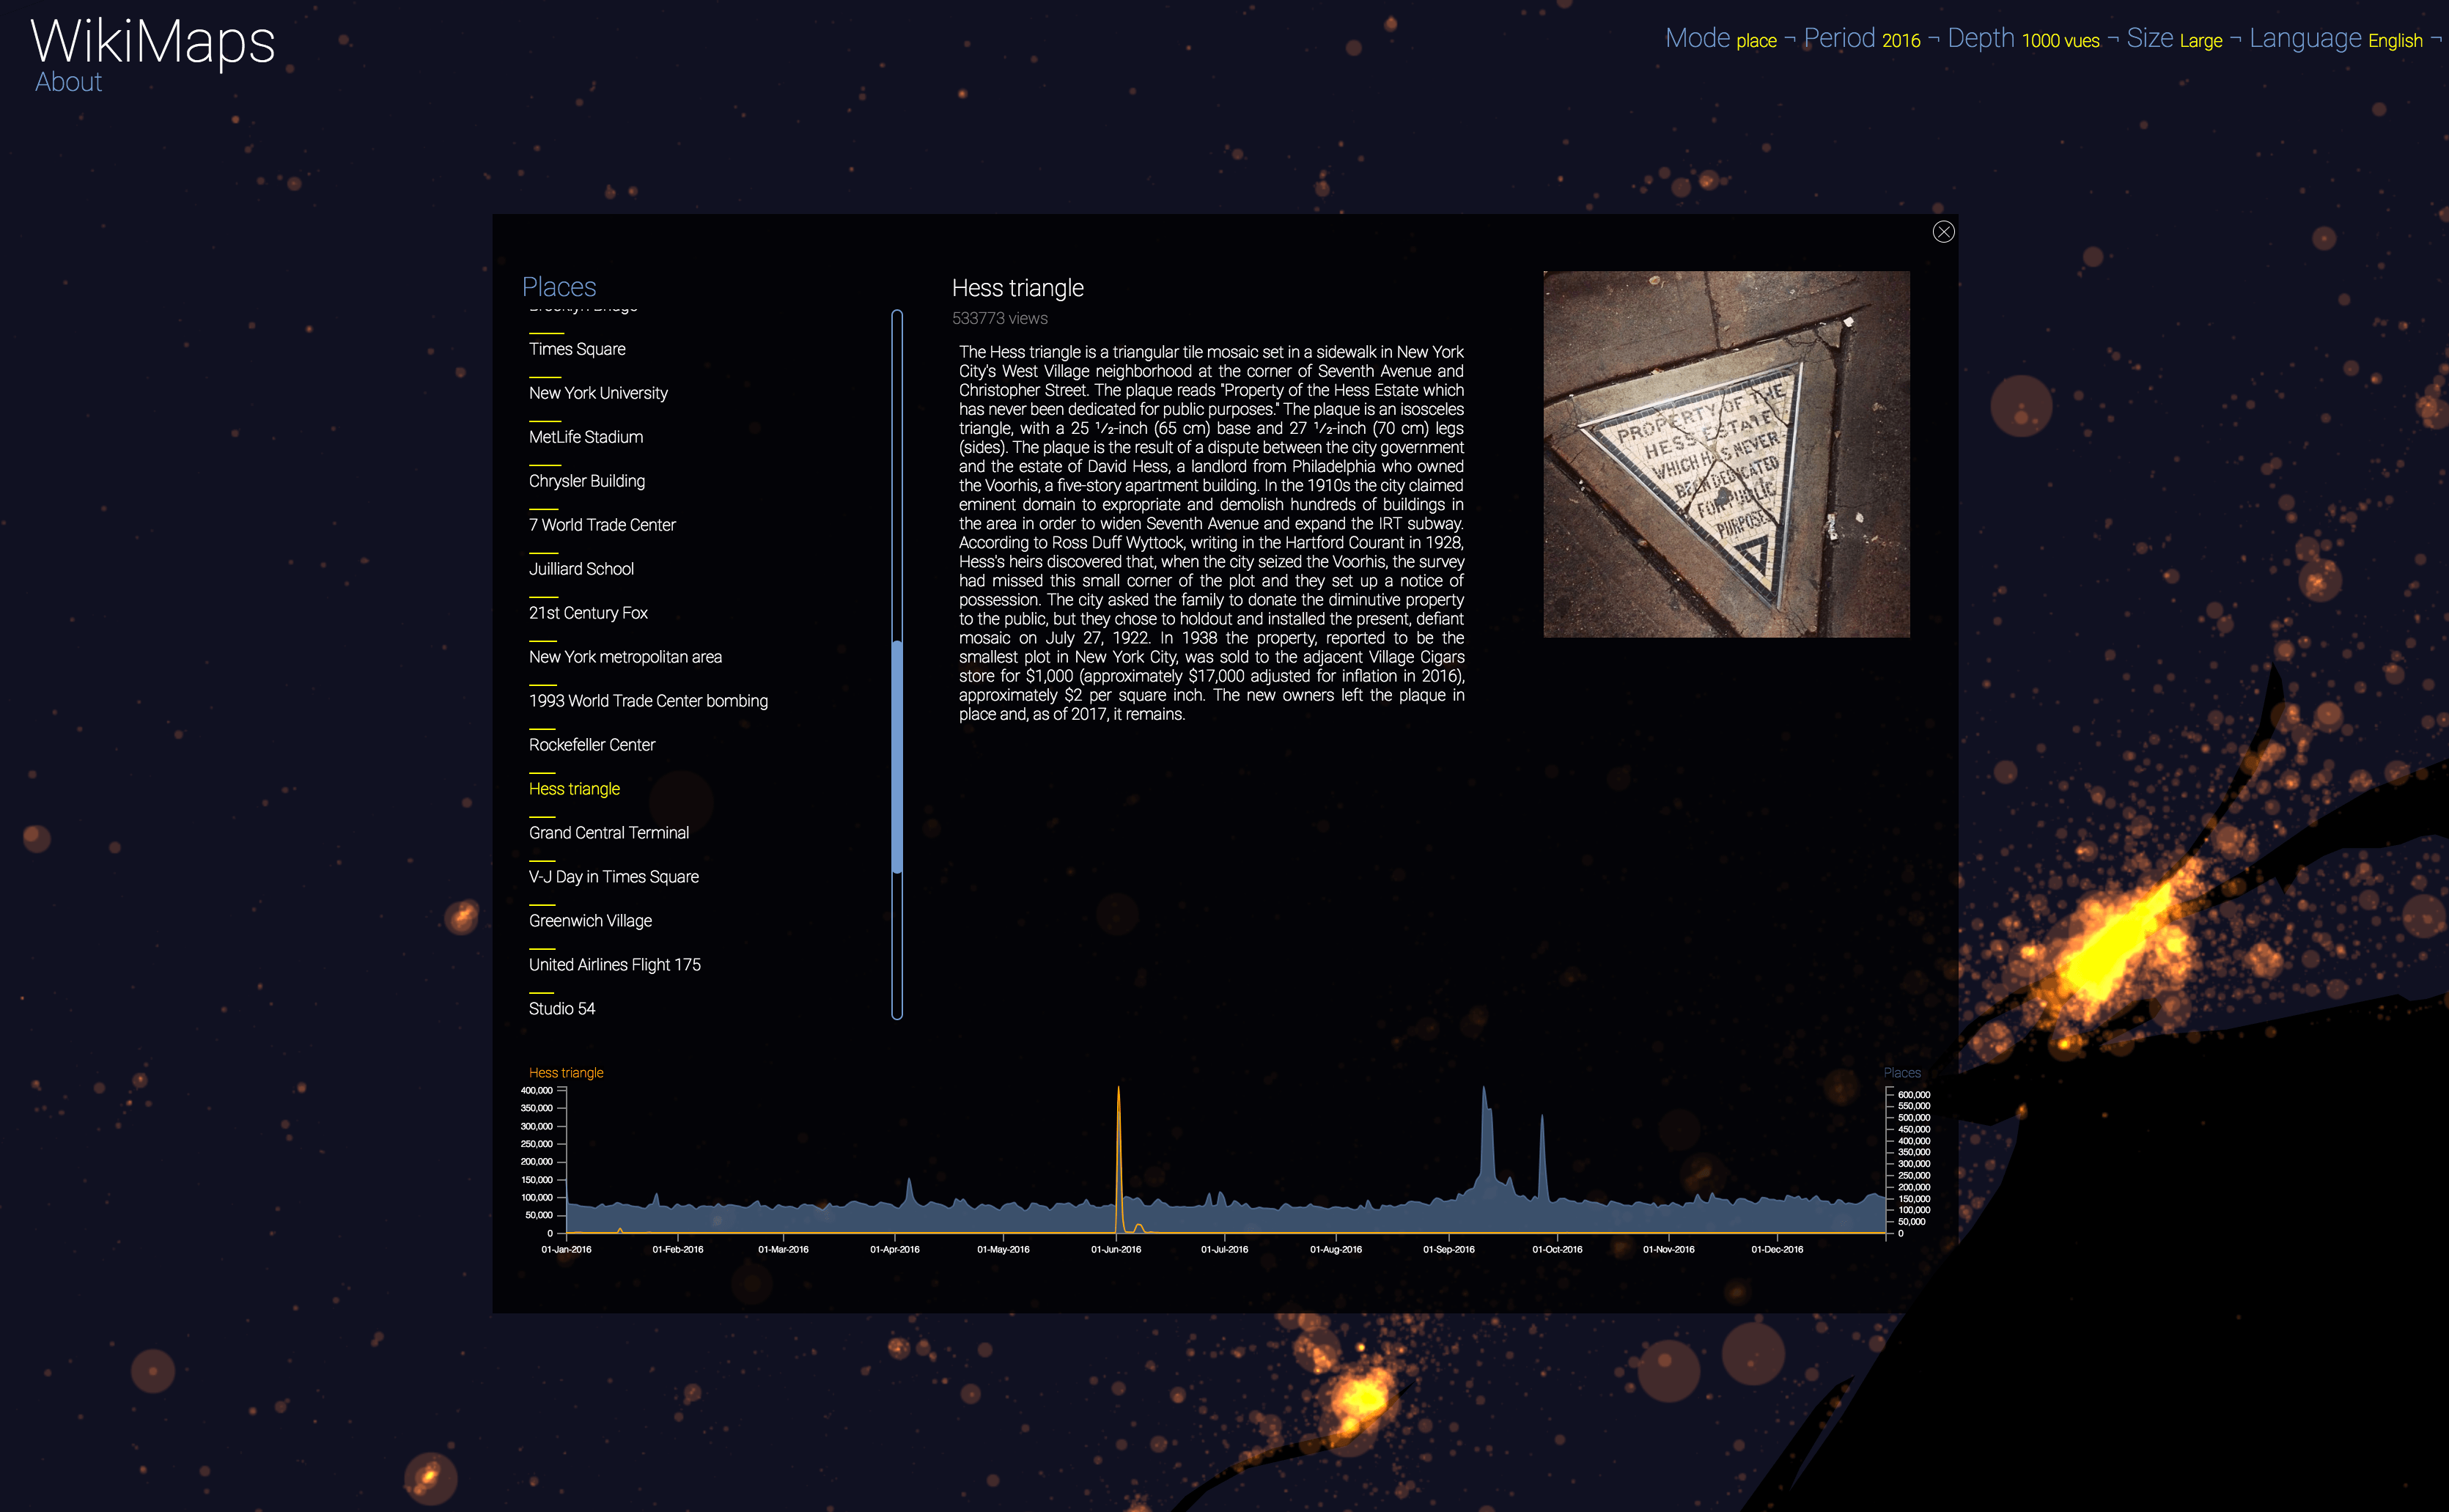
Hess Triangle - English - 2016
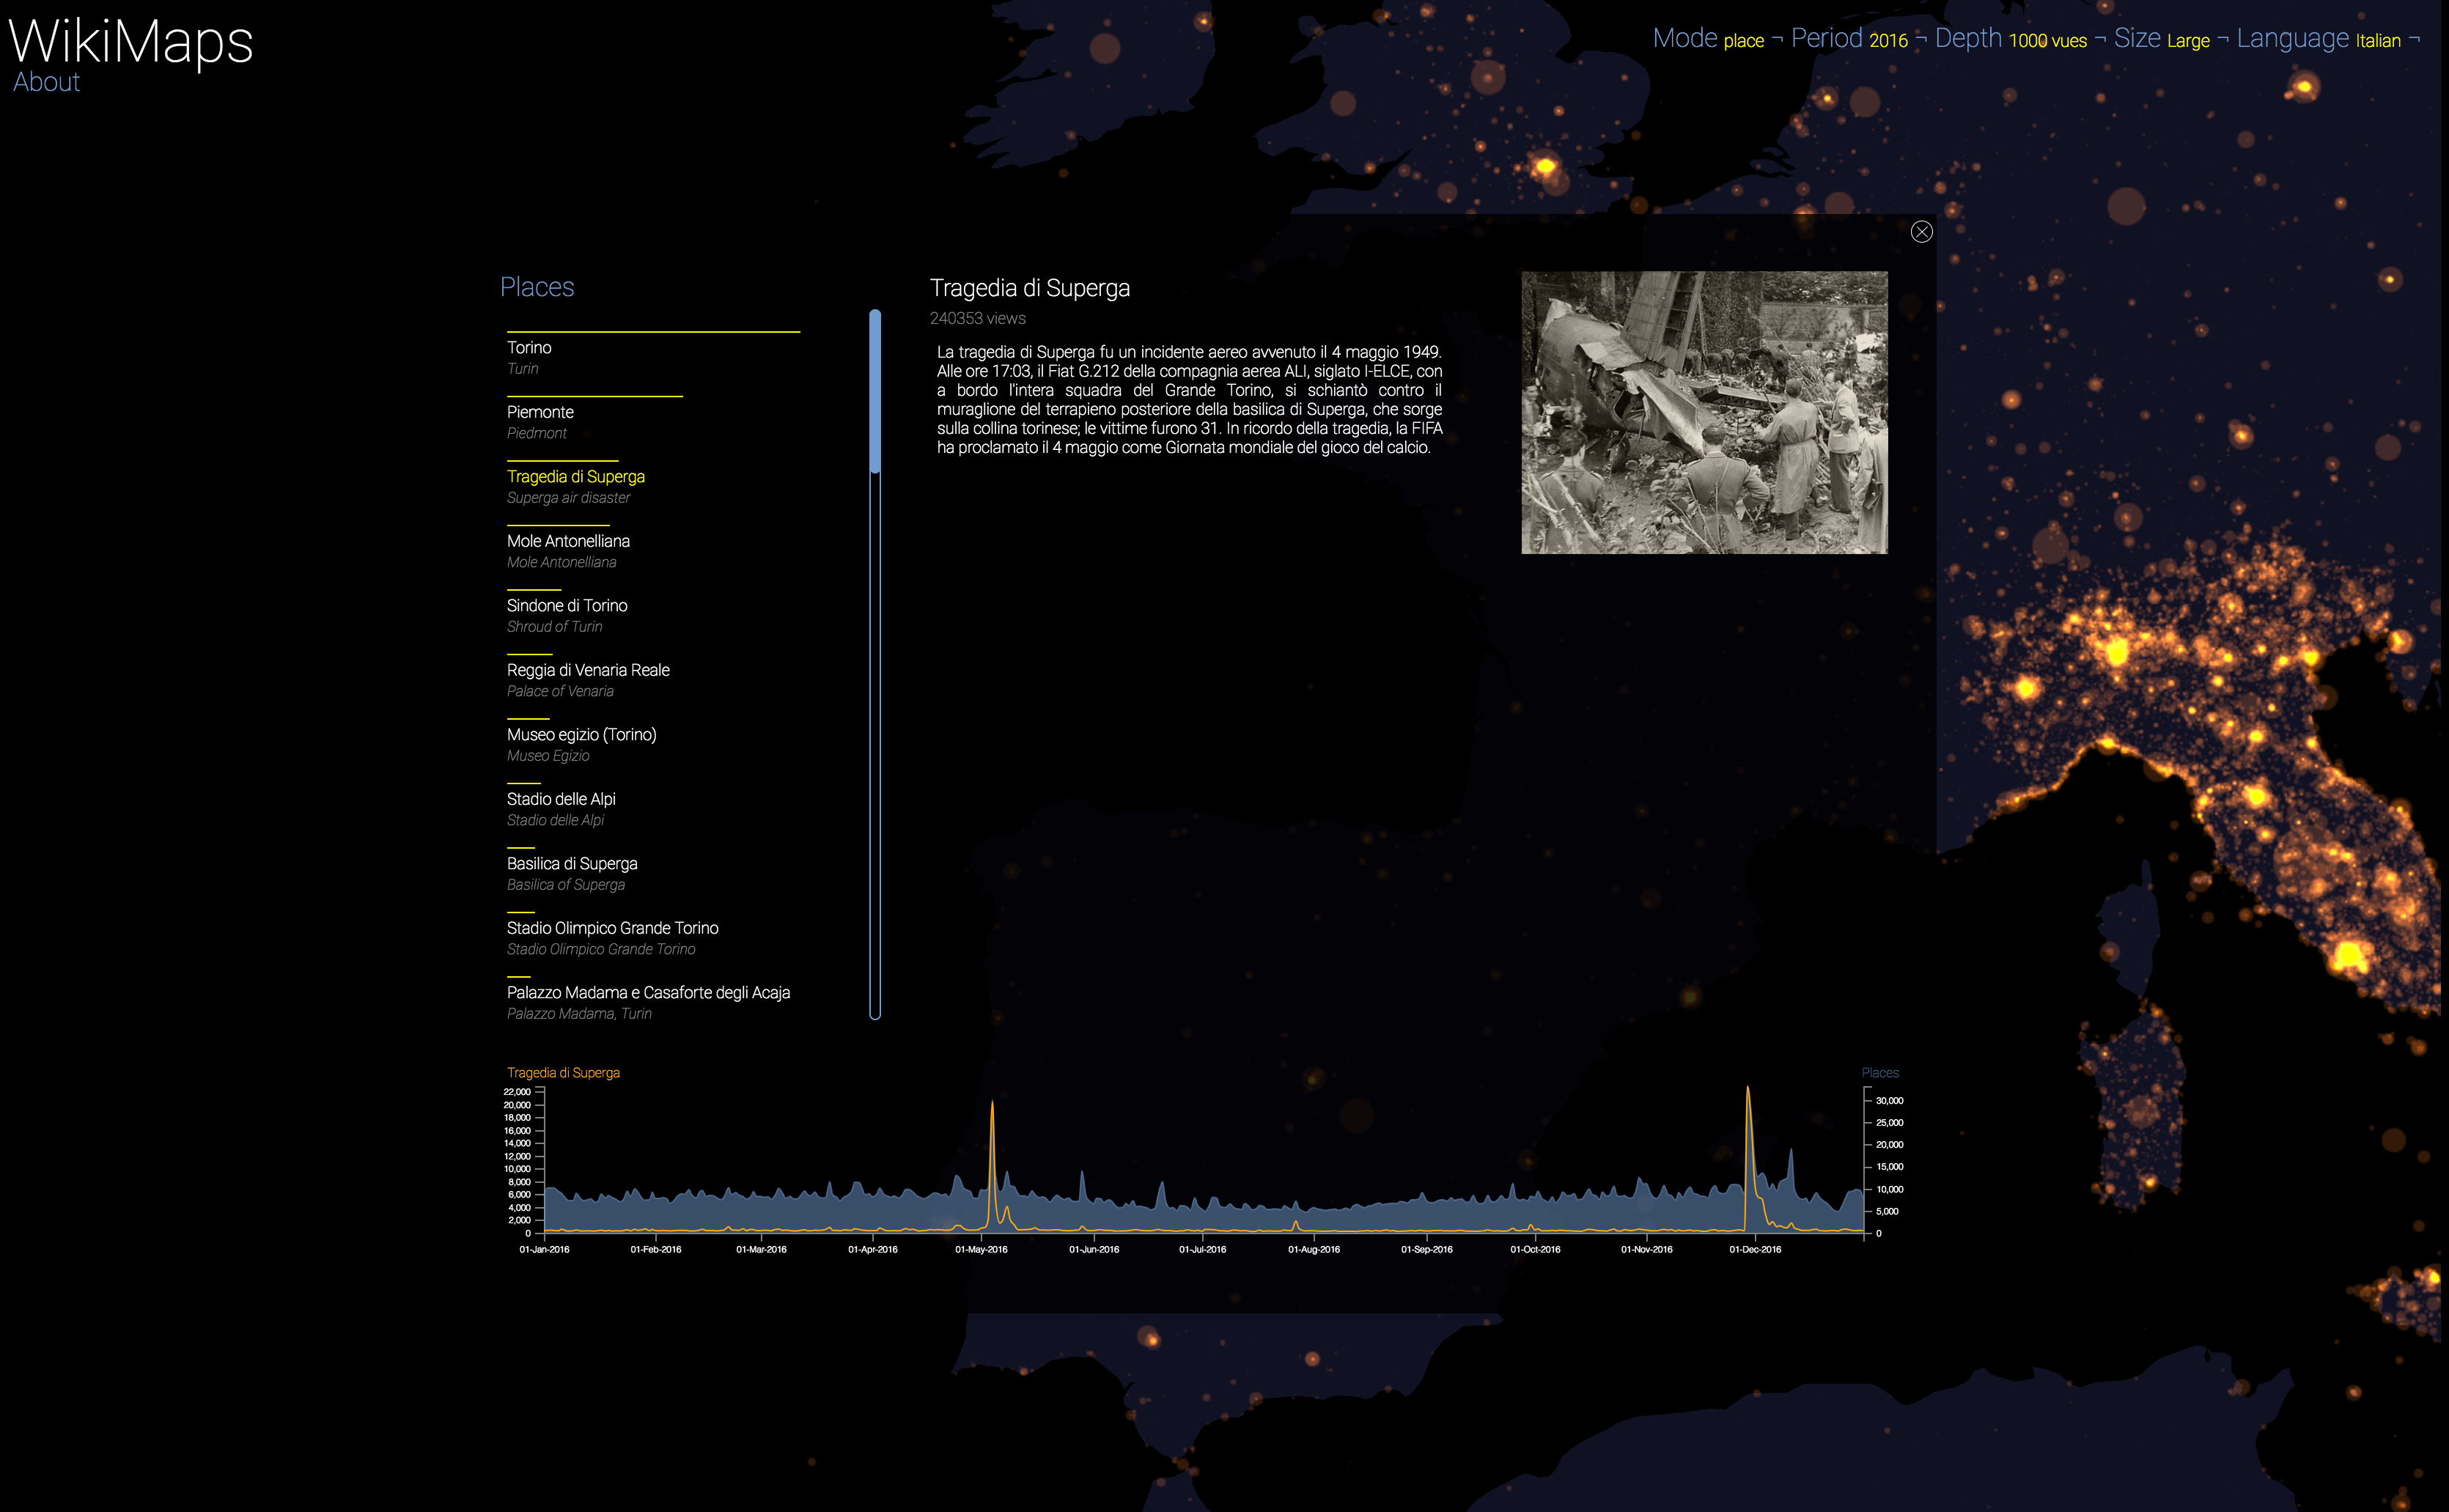
Tragedia di Superga - Italian - 2016
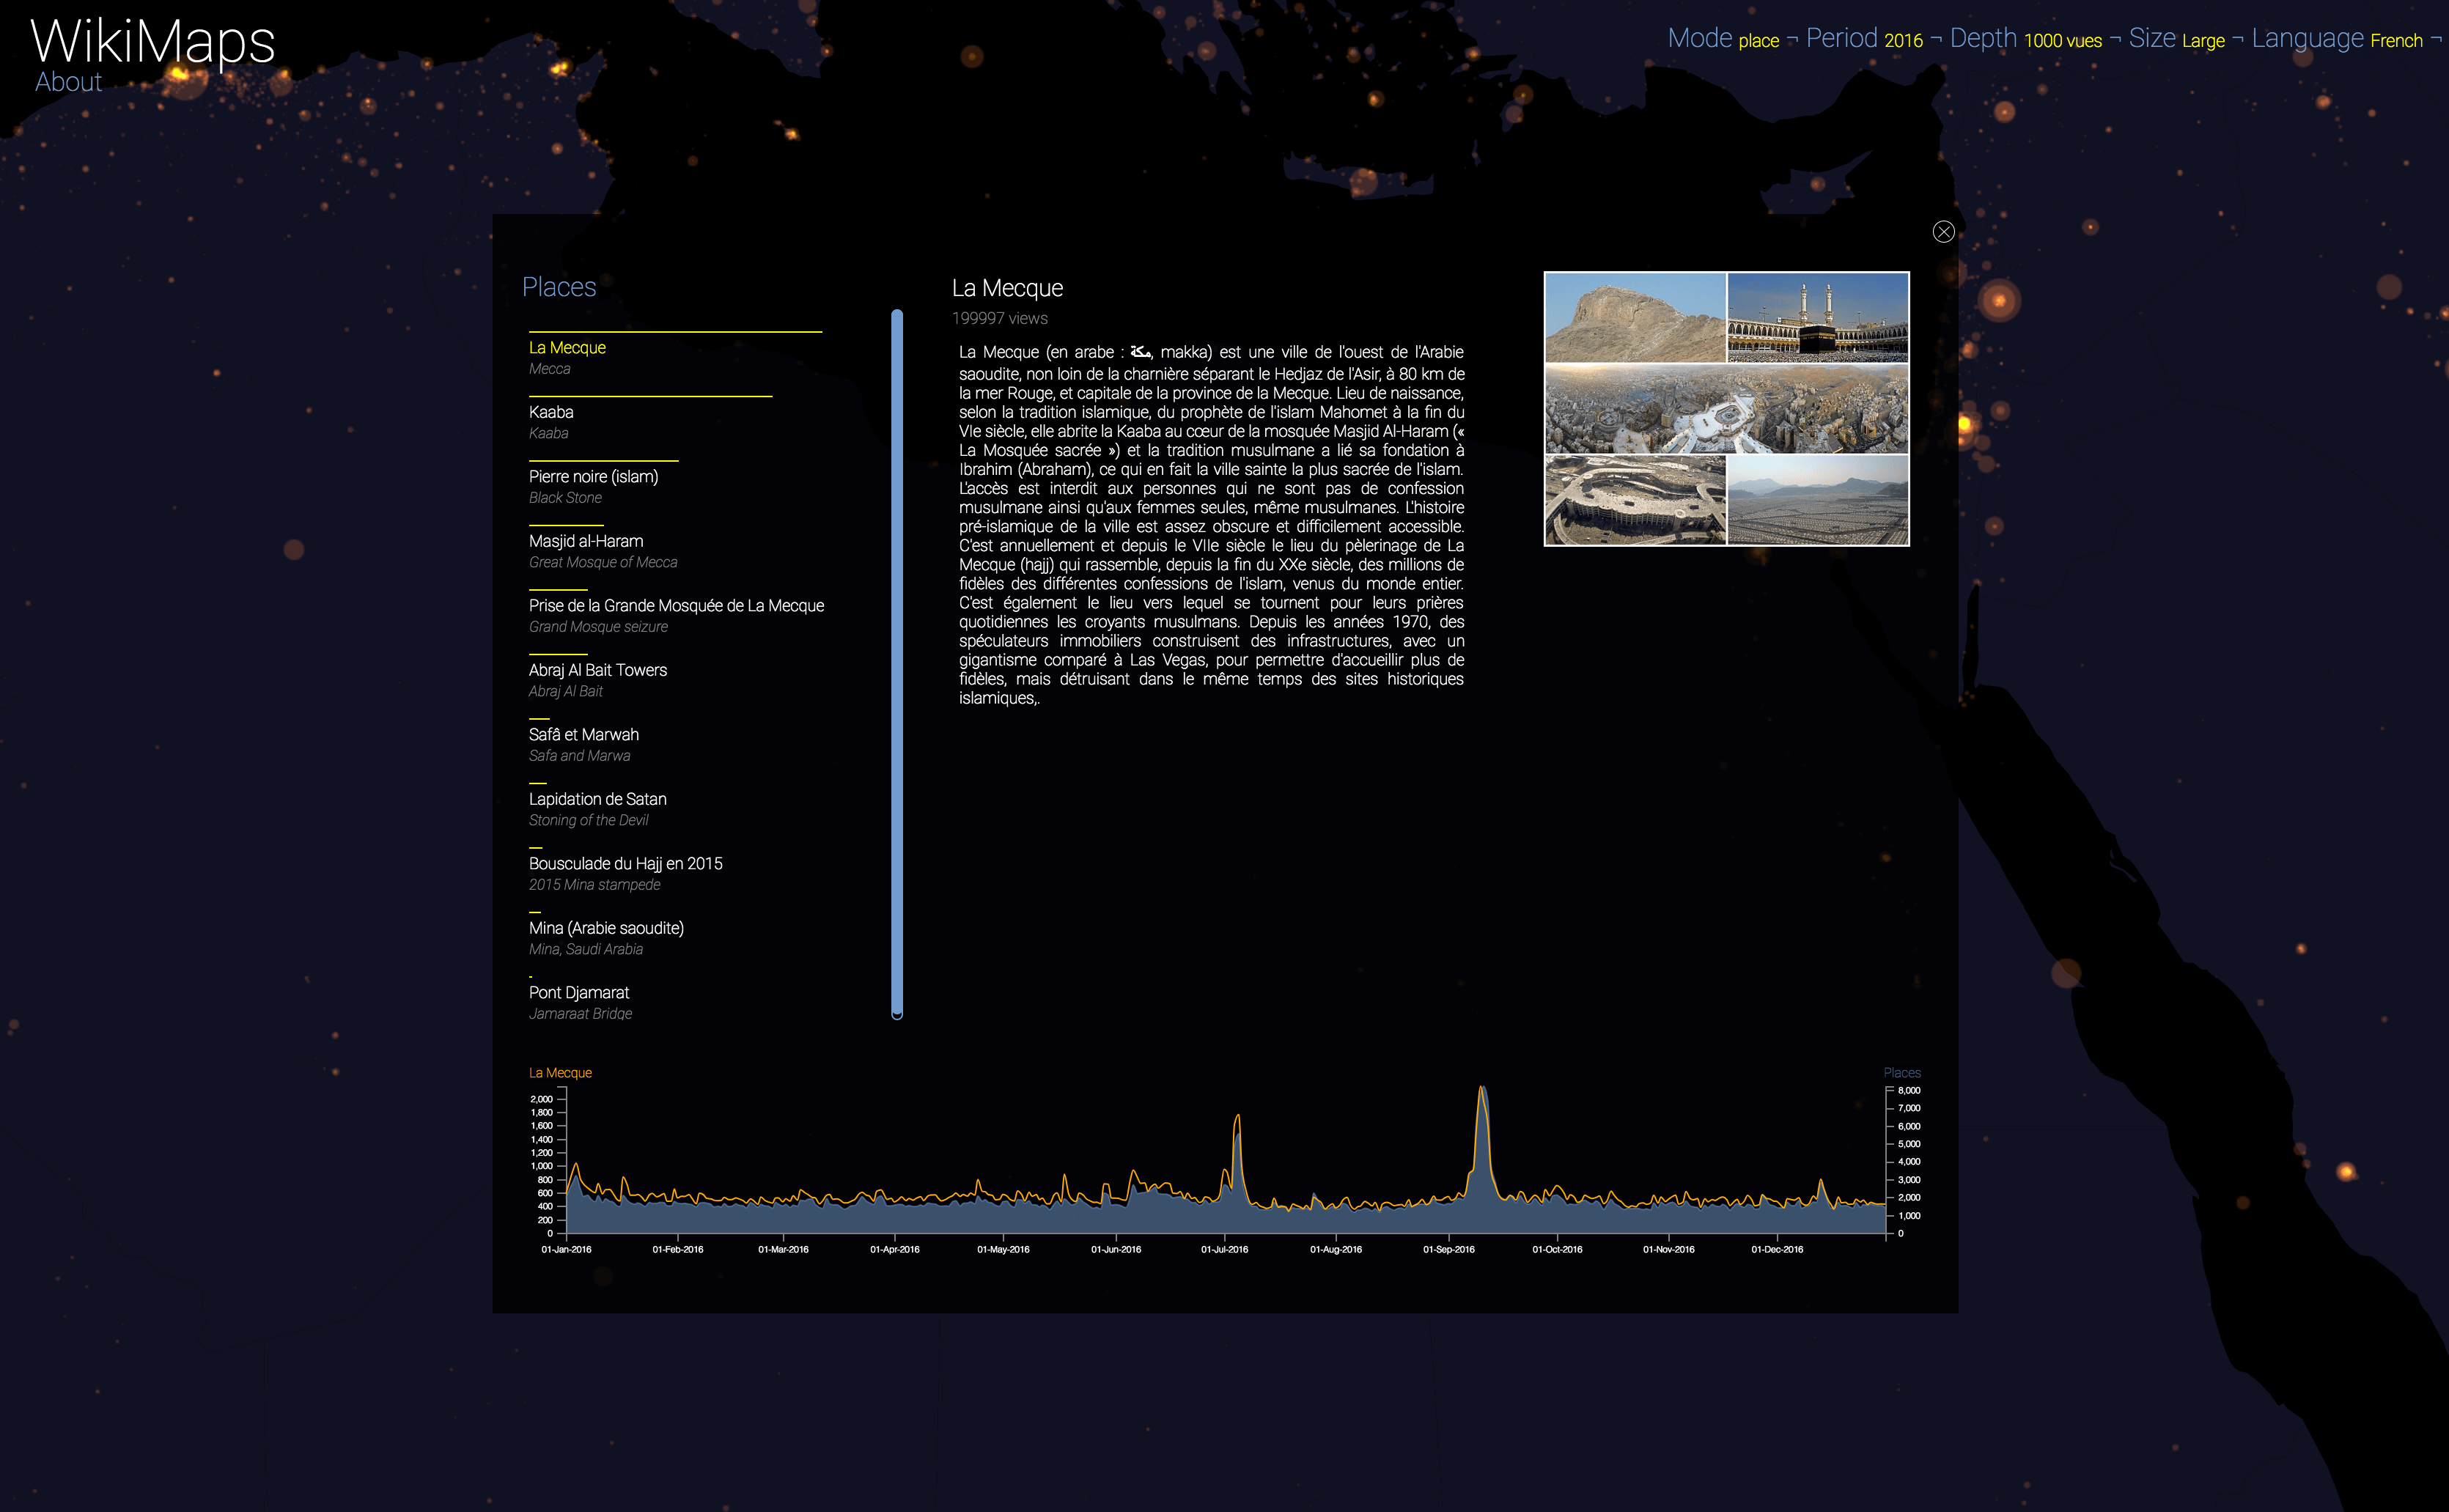
La Mecque - French - 2016
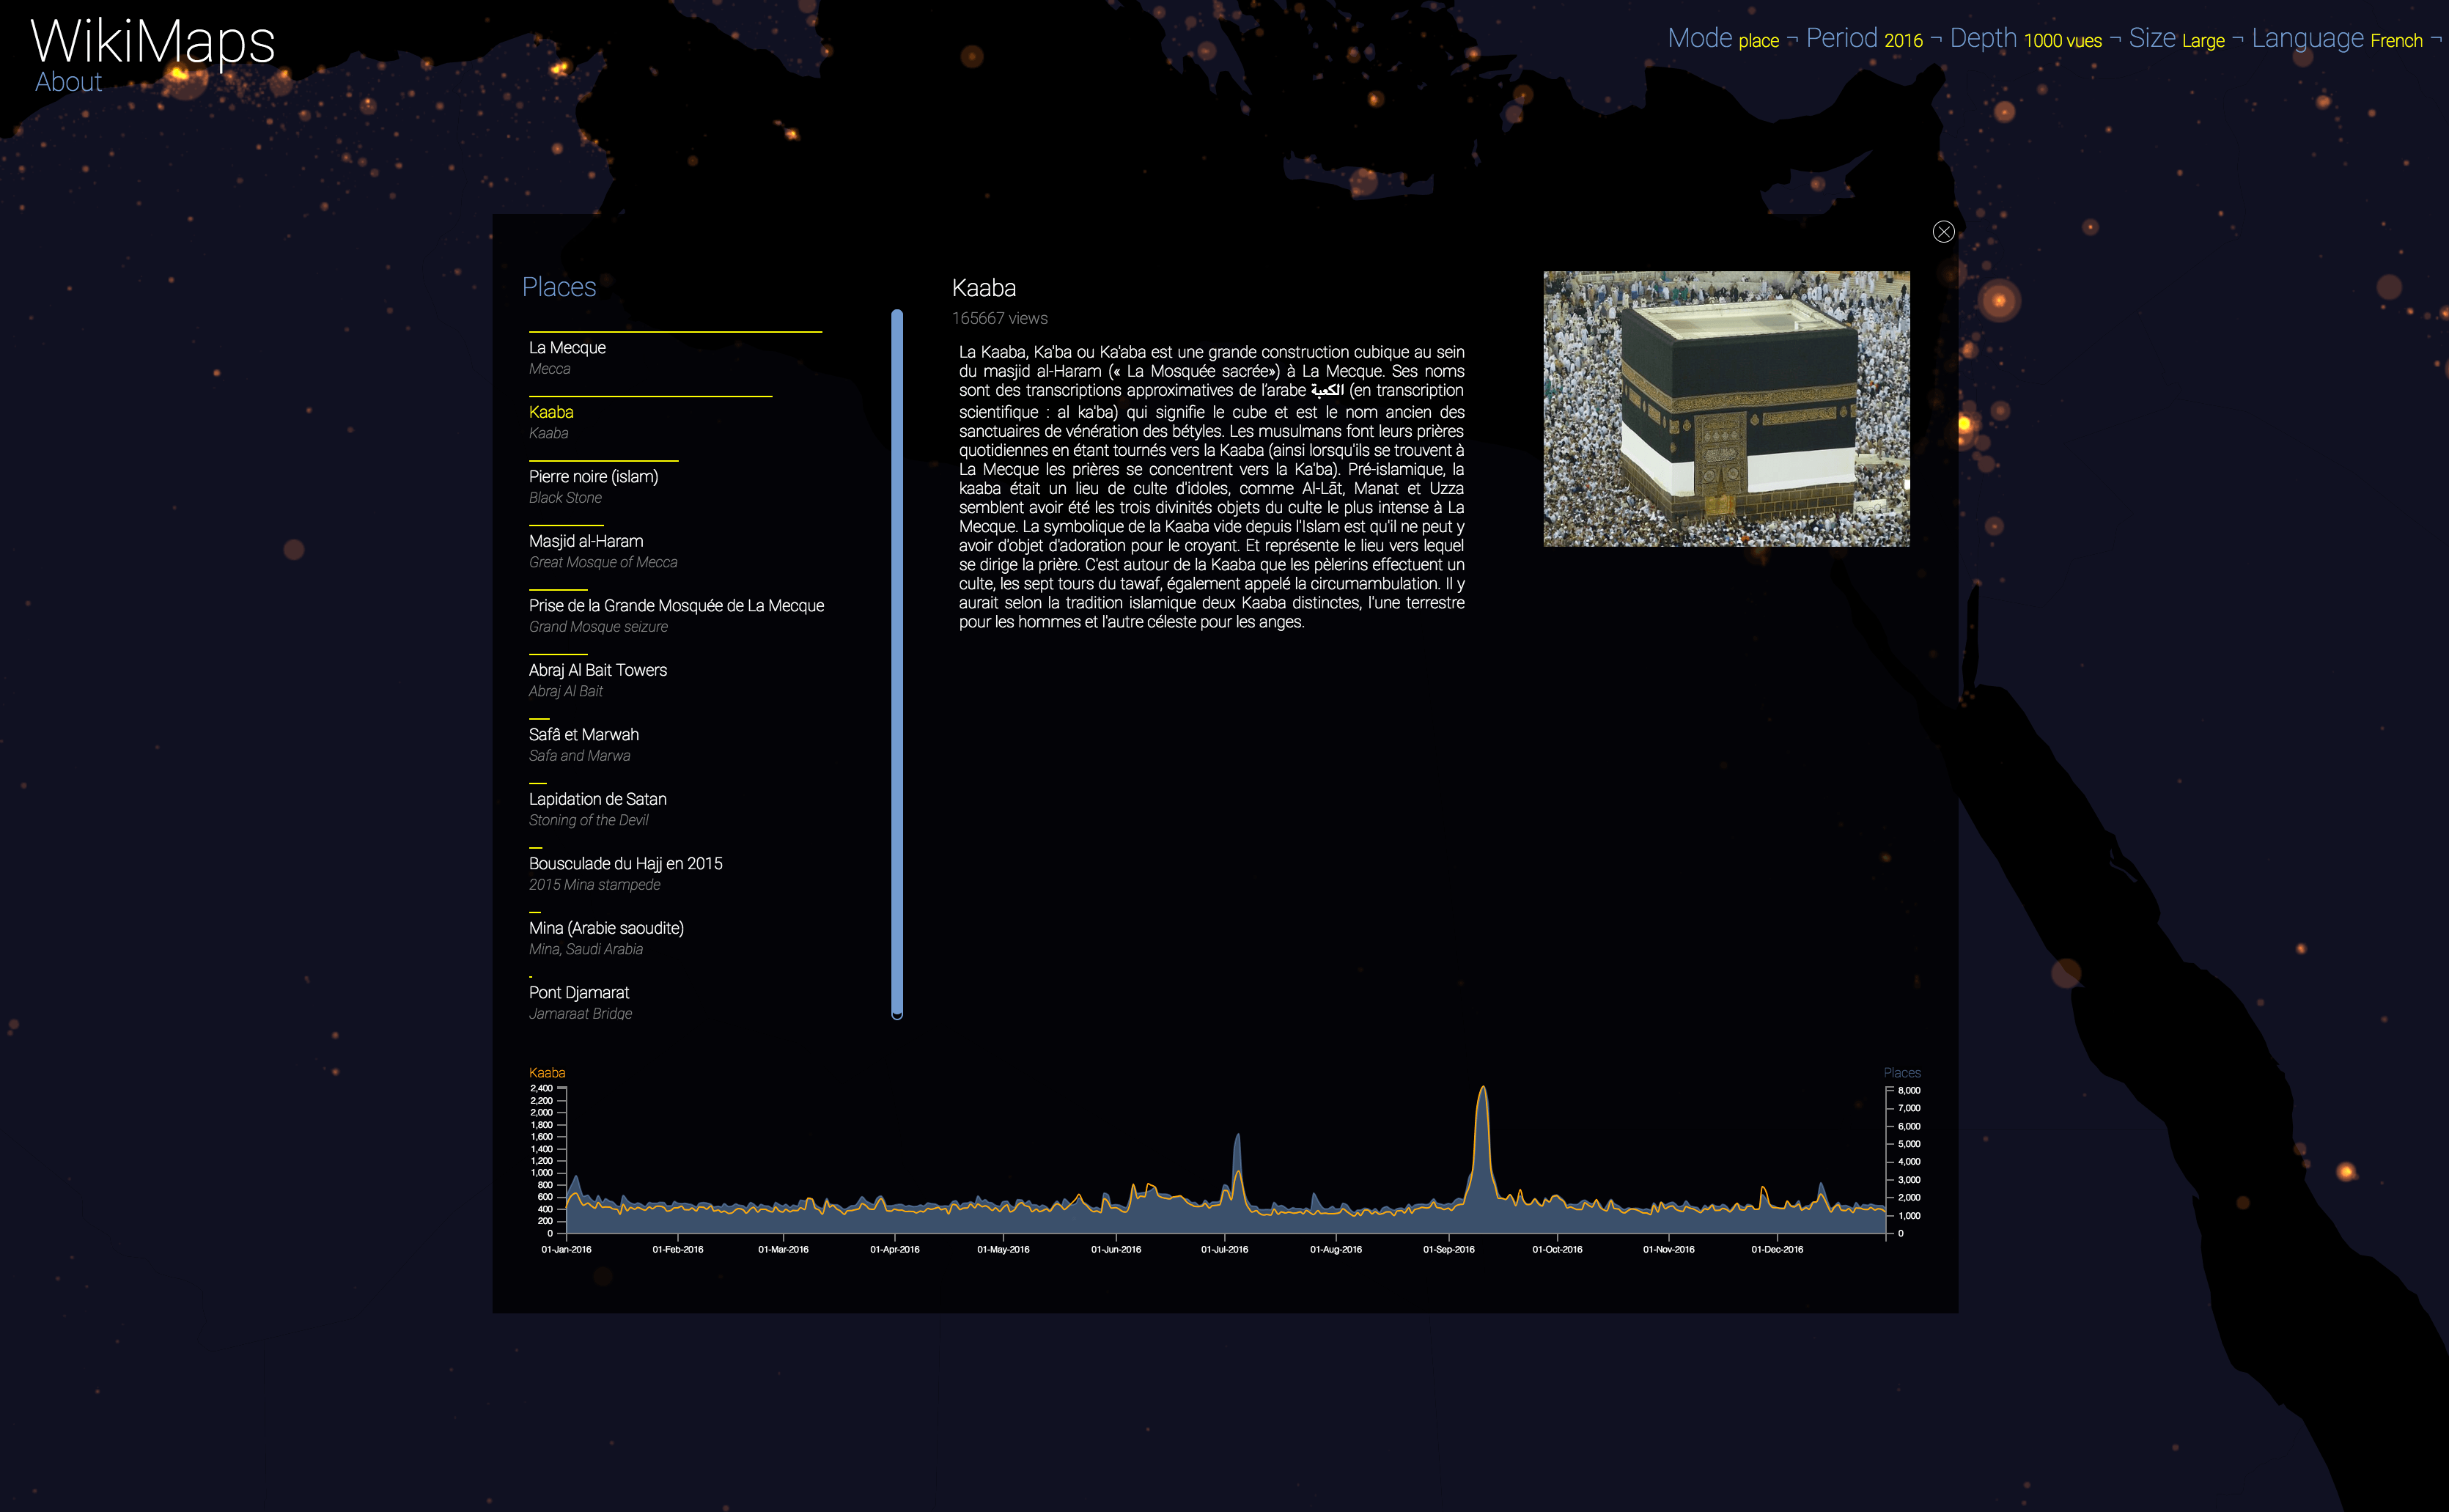
Kaaba - French - 2016
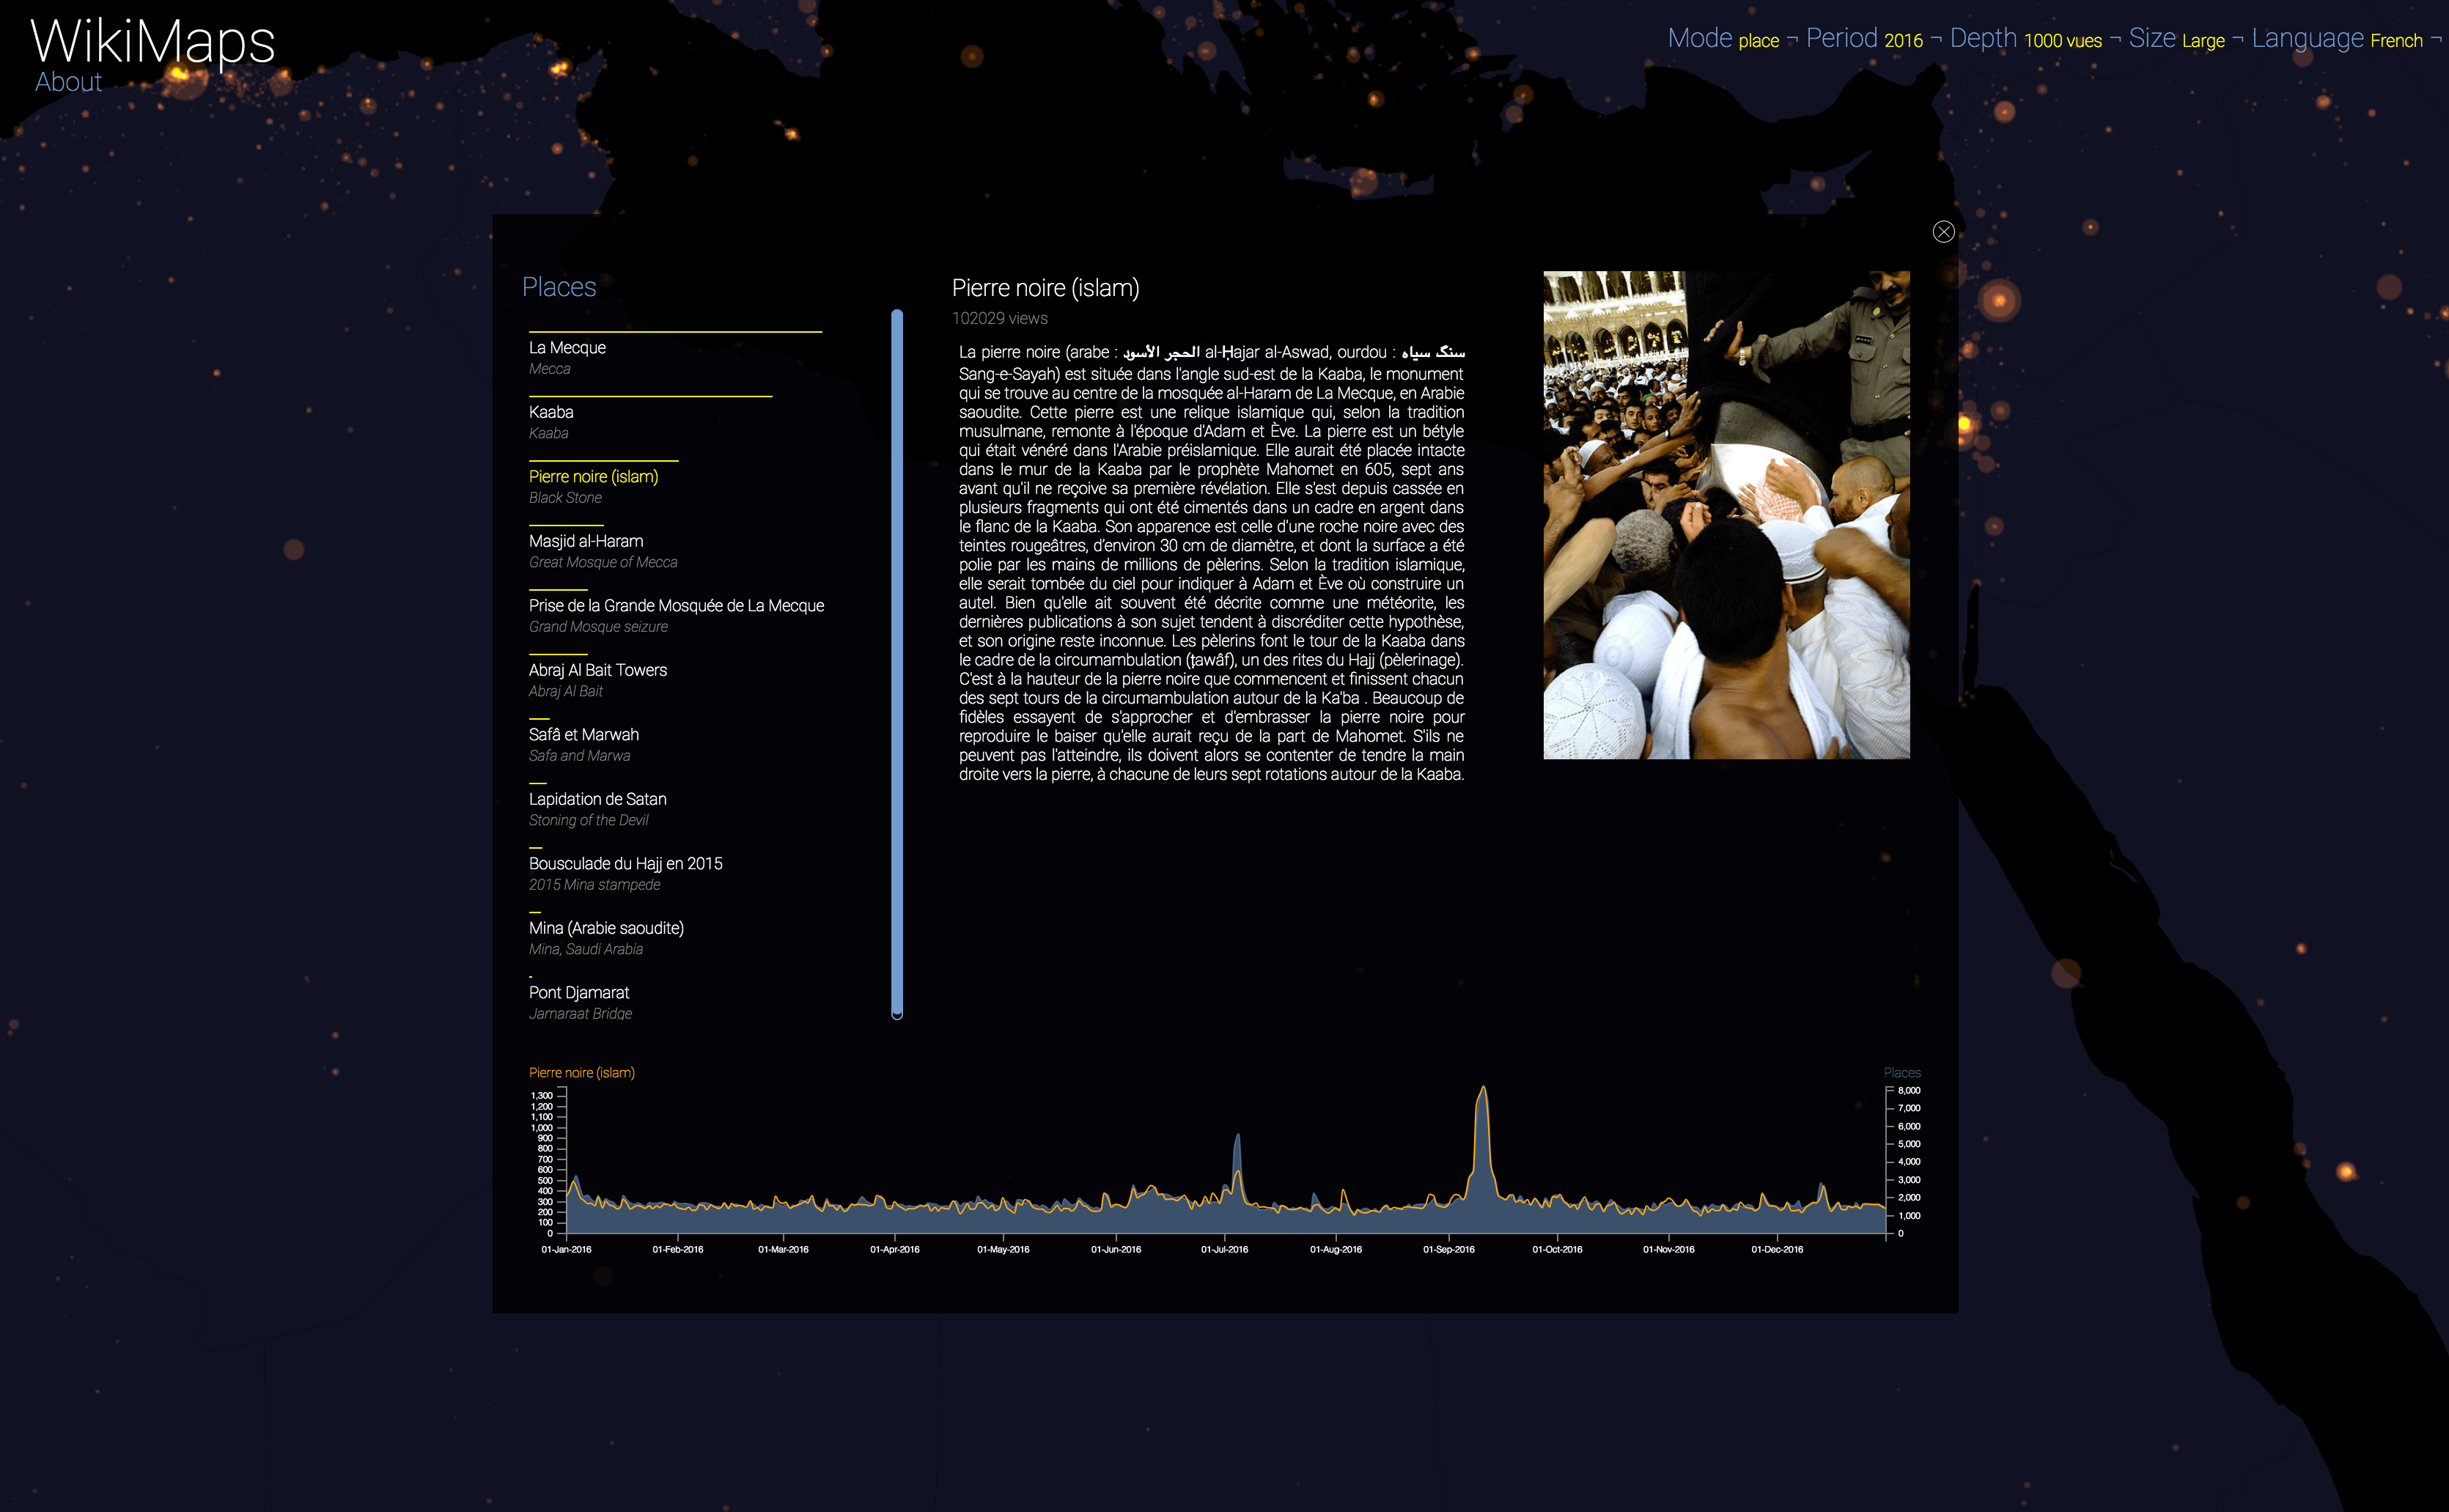
Pierre noire (Islam) - French - 2016
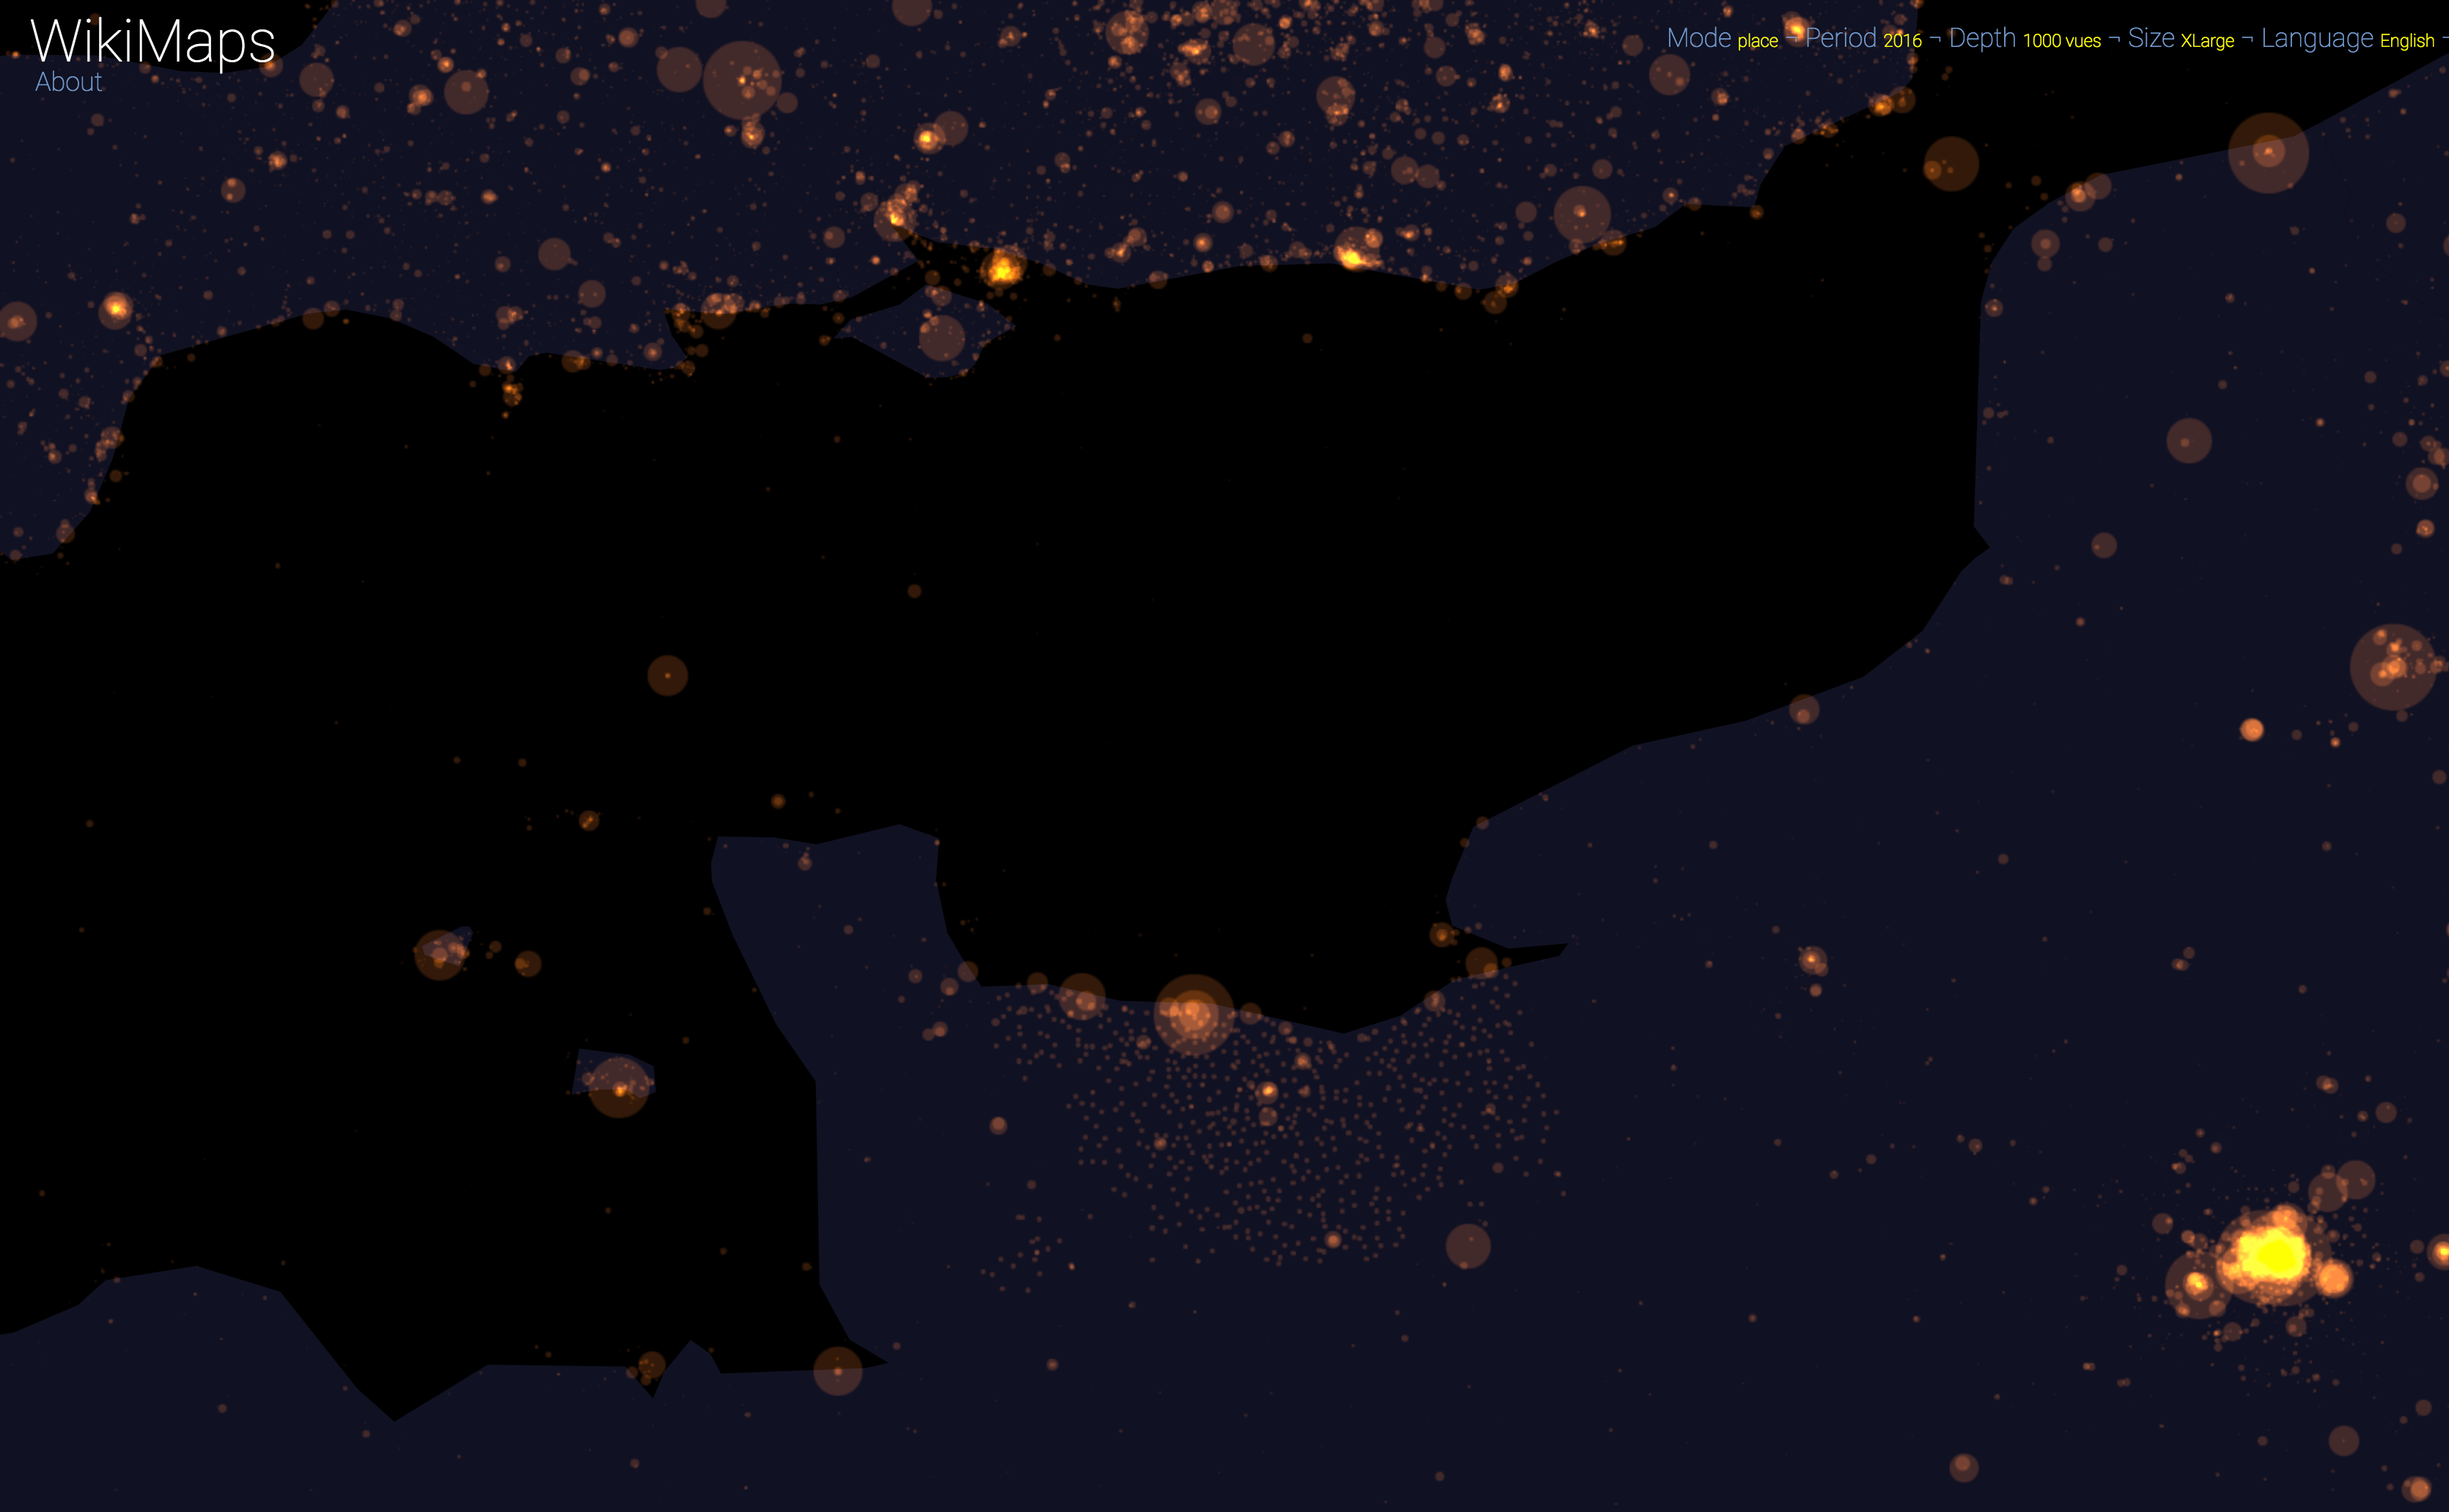
Normandy - English - 2016
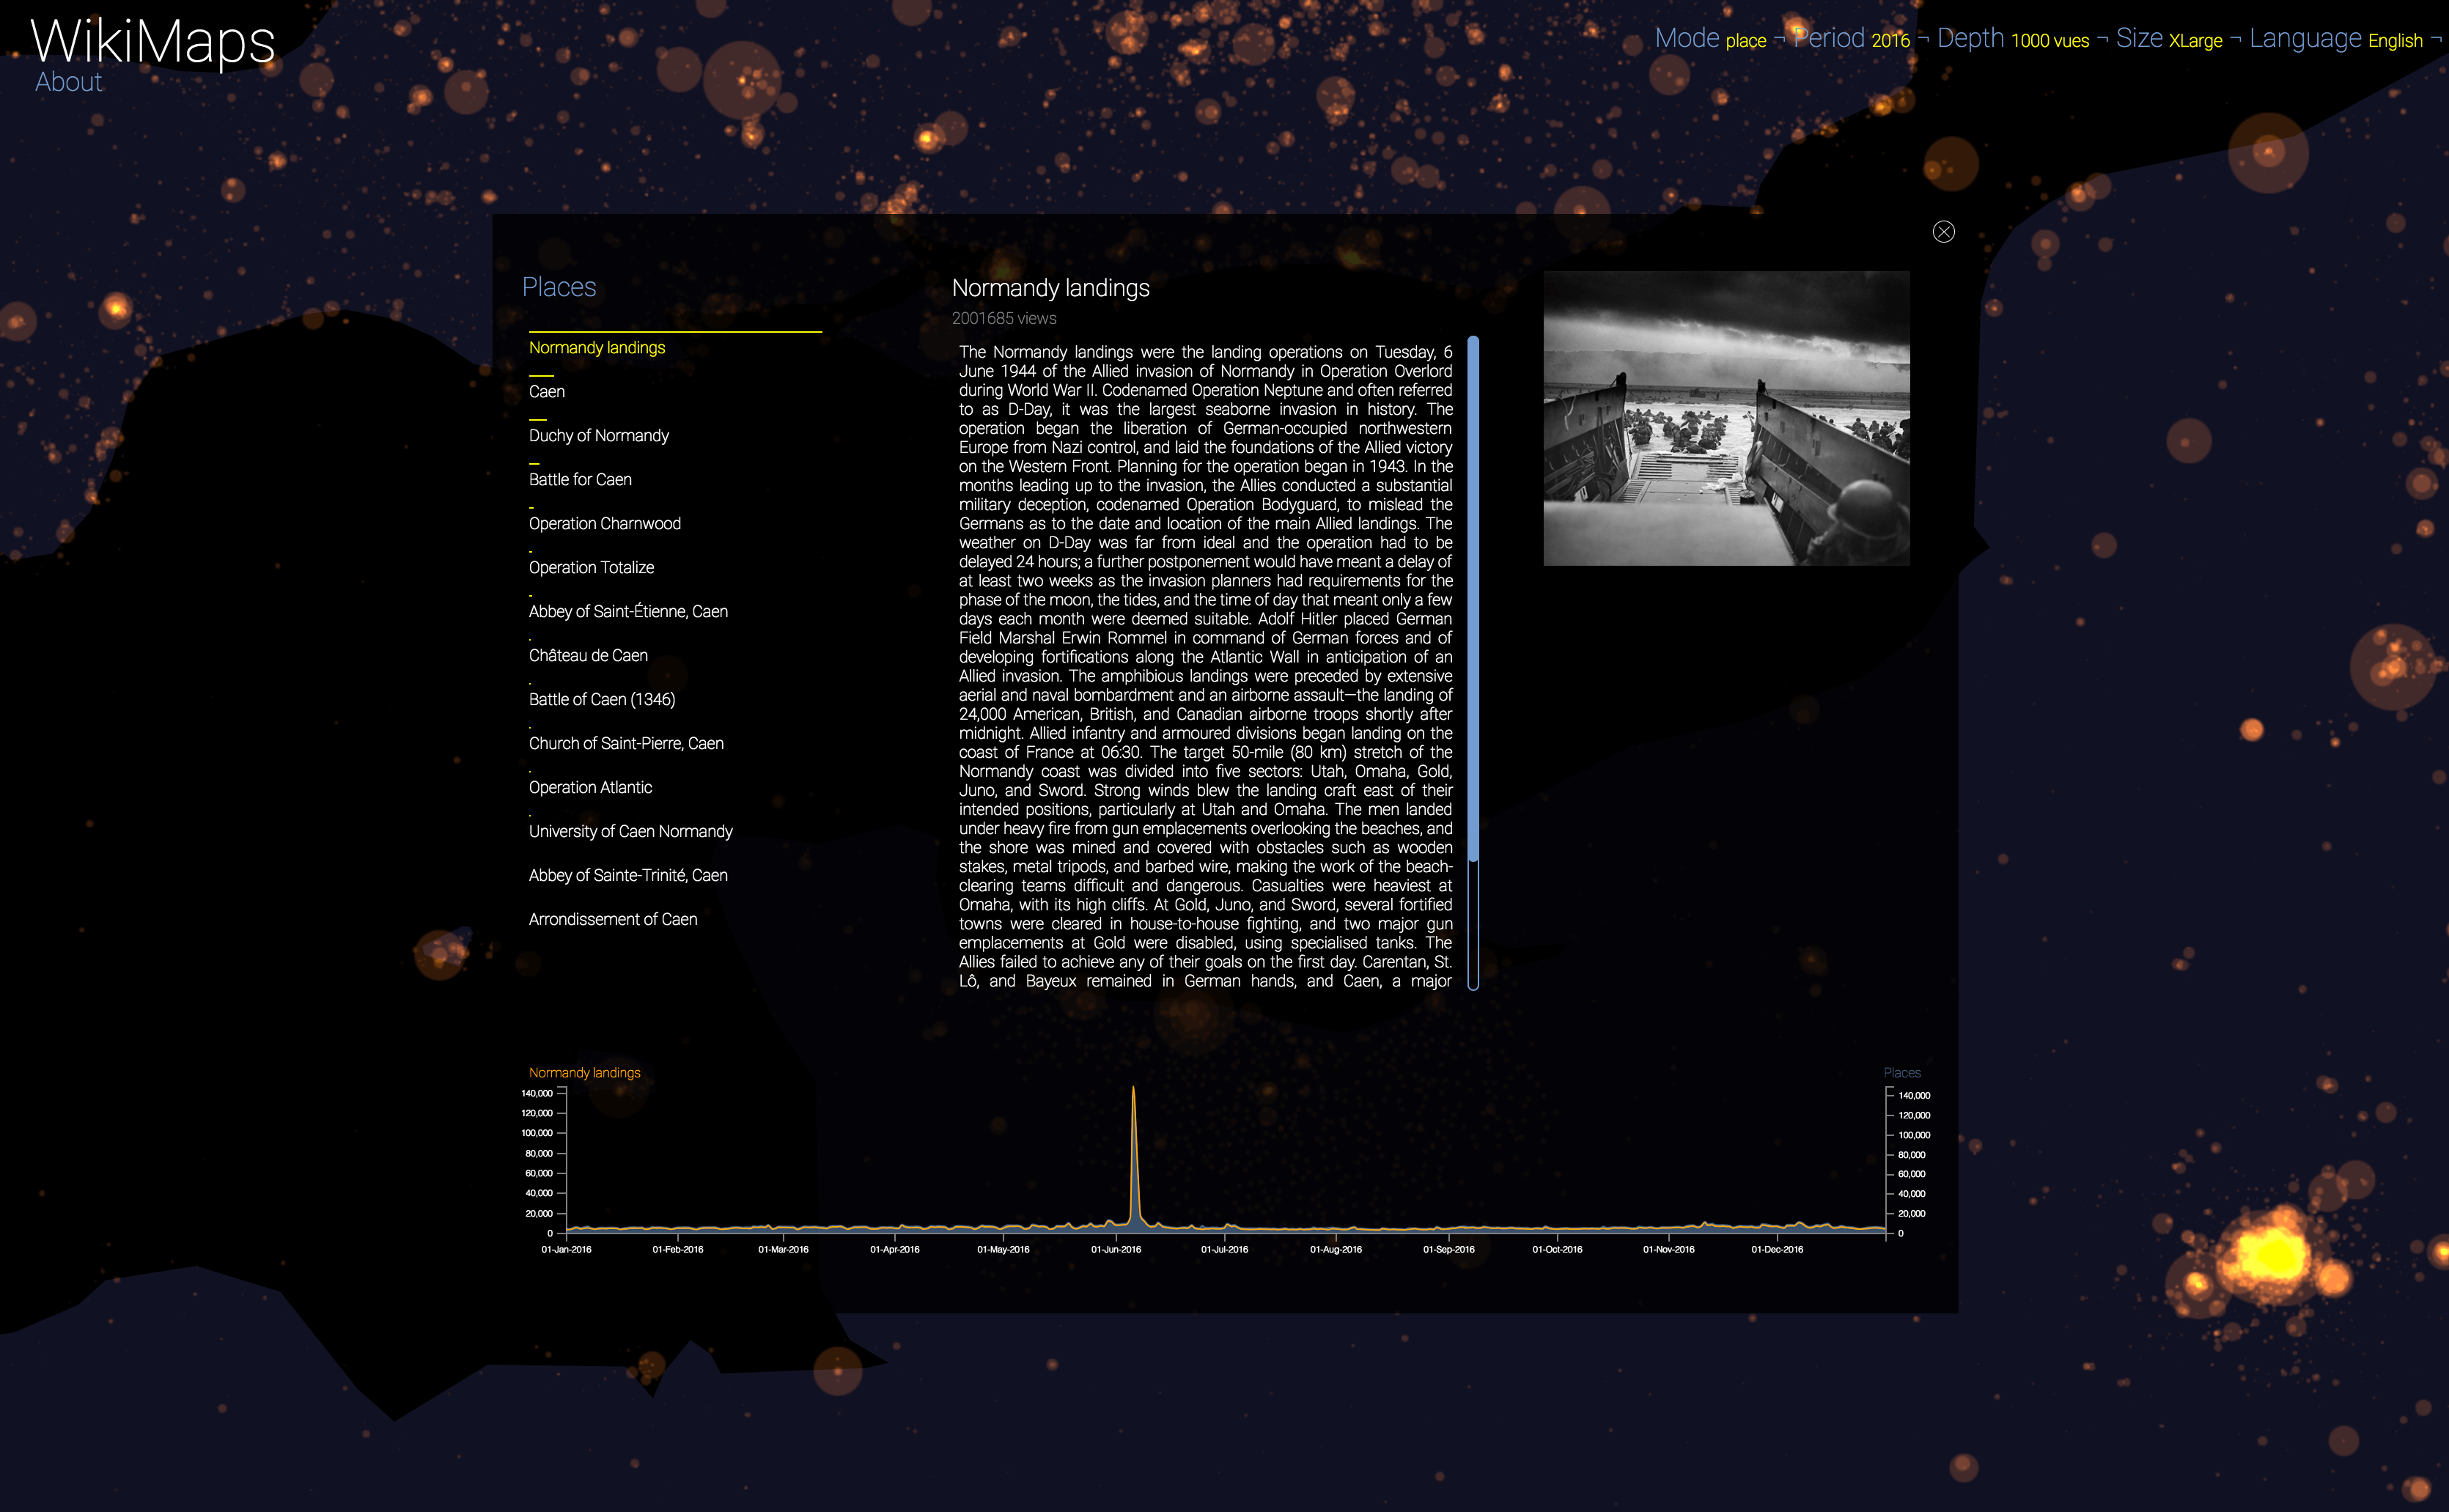
Normandy landings - English - 2016
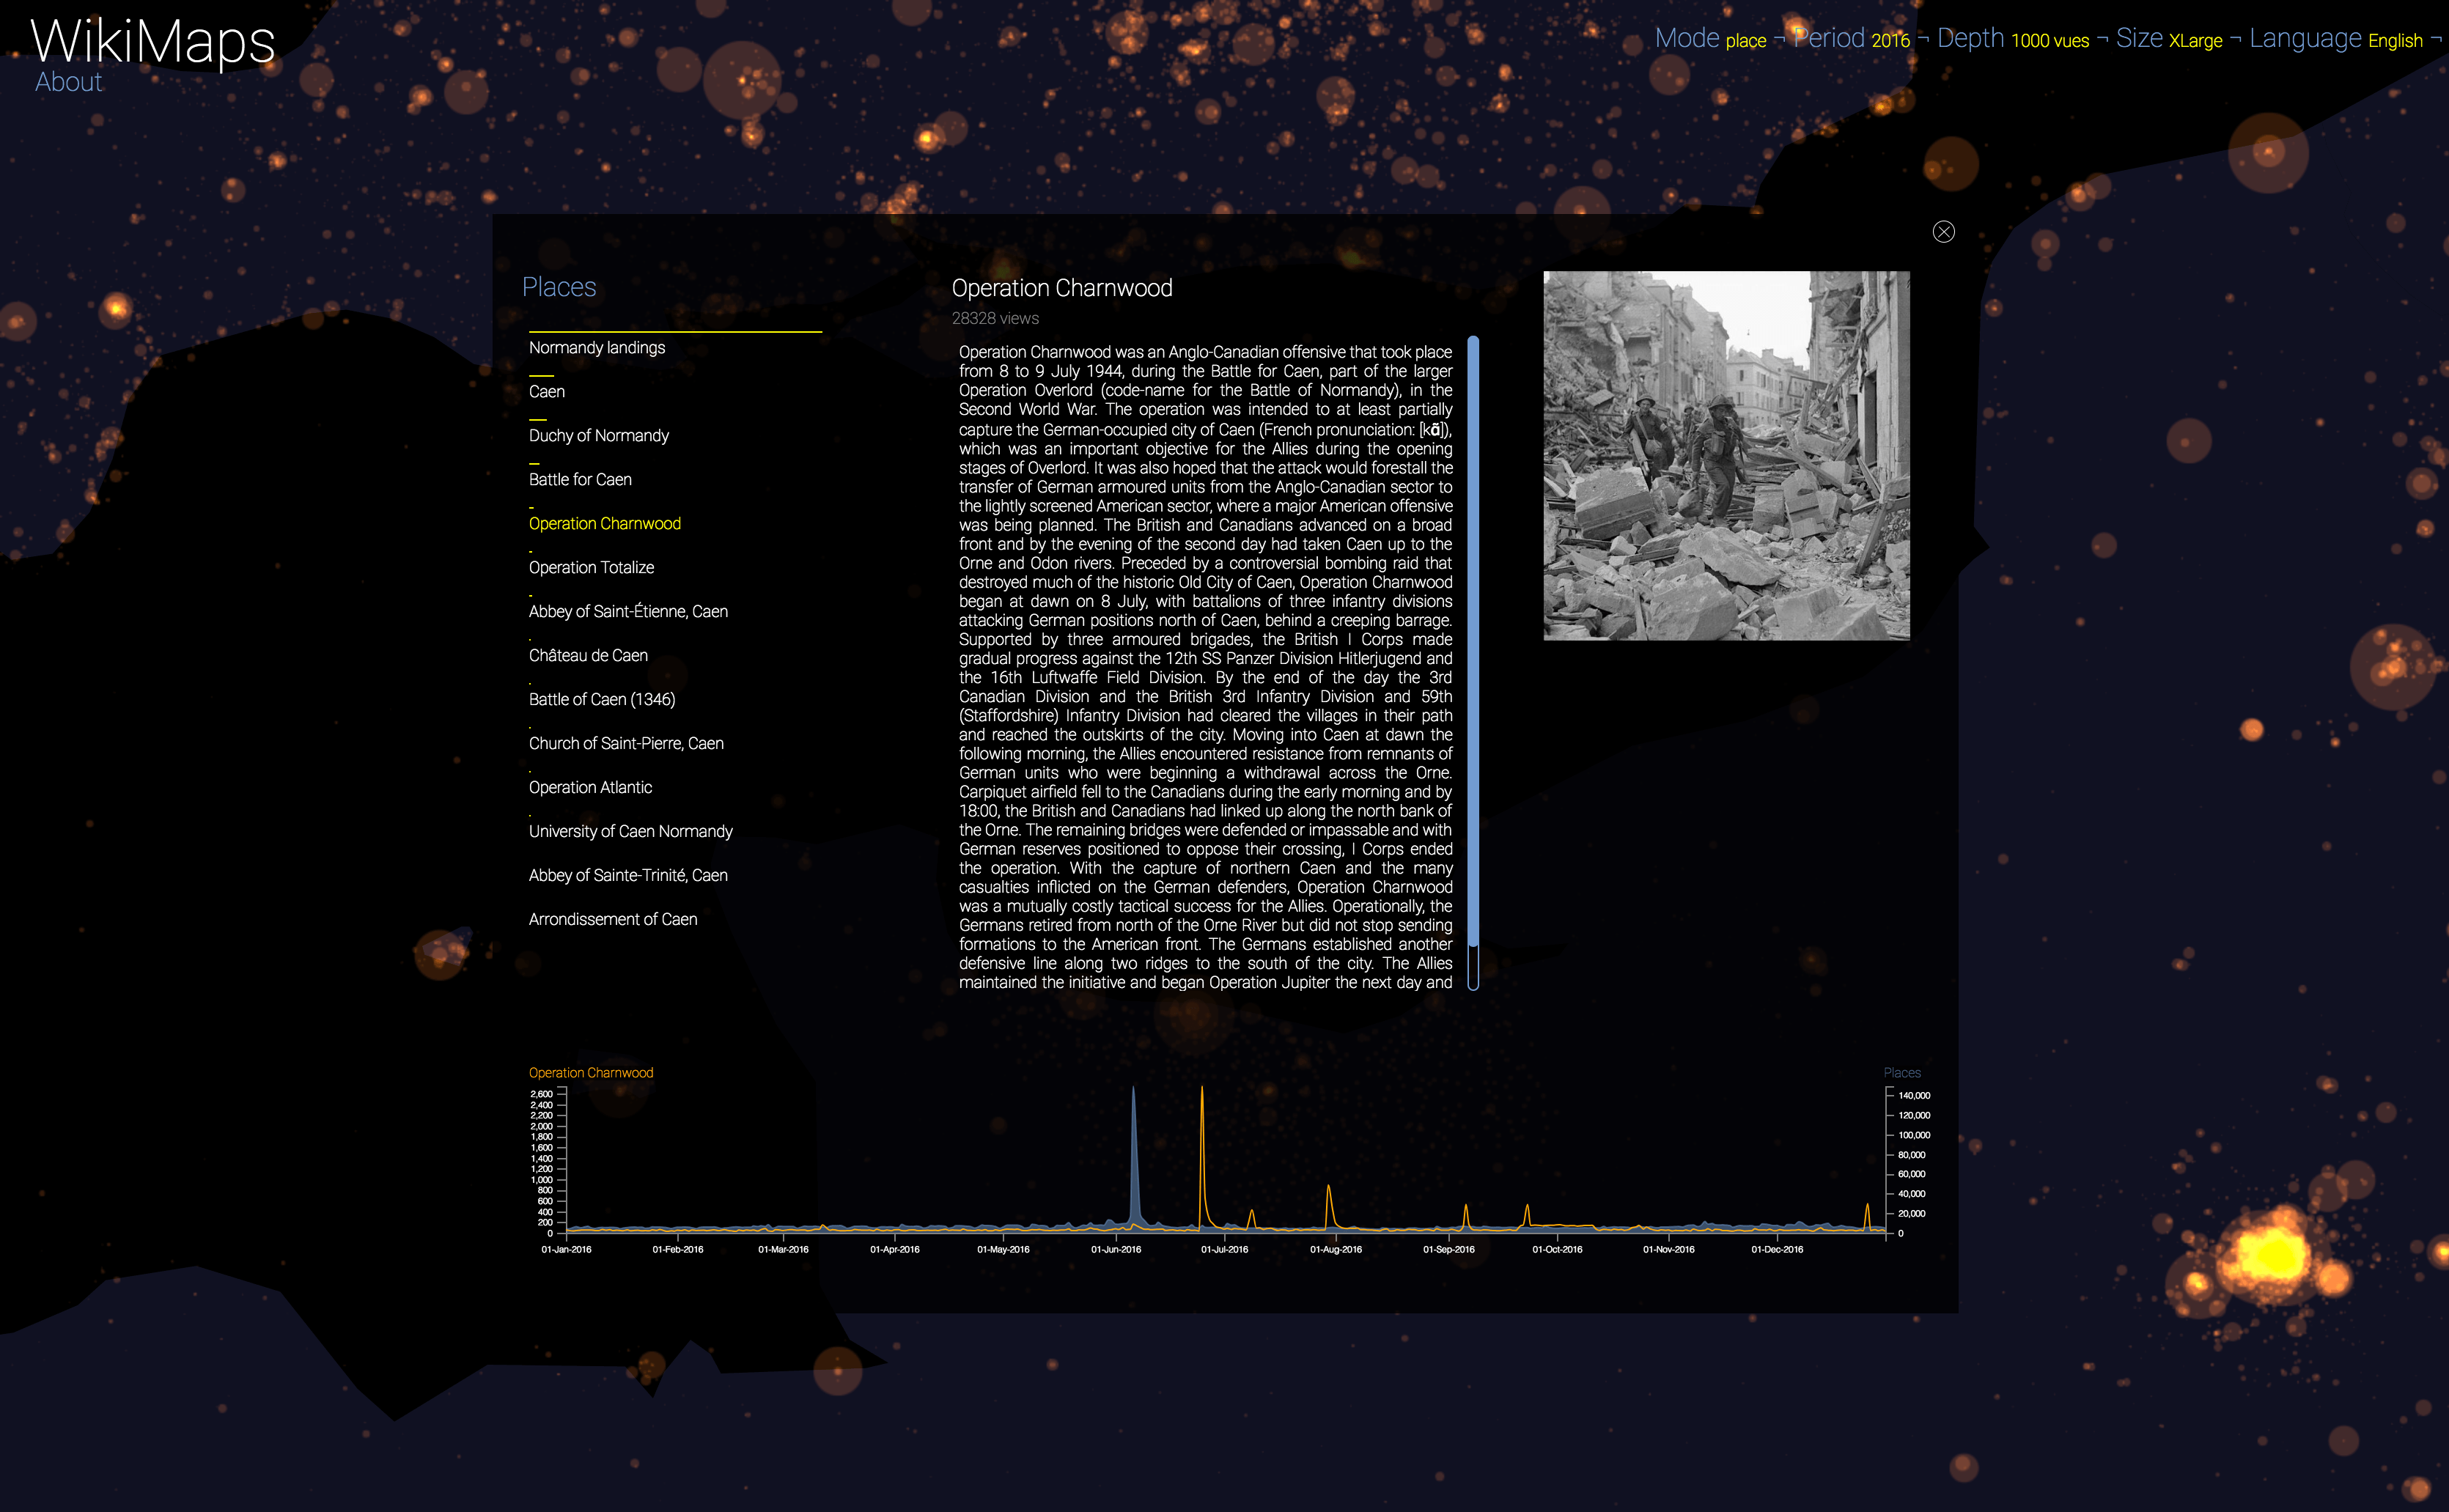
Operation Charnwood - English - 2016
WikiMaps allows you to select any part of the world and identify the places that arouse the greatest interest.
Selecting a location activates a dashbord. It presents on the left the list of the 50 most consulted pages, on the right an automatic description of the most consulted page, as well as the evolution of its daily consultations during the considered year at the bottom.
Once the dashboard is activated, it is possible to select any of the locations and compare the evolution of its consultations (in yellow) with that of the entire area considered (in blue).
The plurality of phenomena that attract collective attention are thus clearly perceptible, with a precision difficult to observe by other means. It appears that attacks, cultural and sporting events and broadcasts constitute the main part of identifiable events.
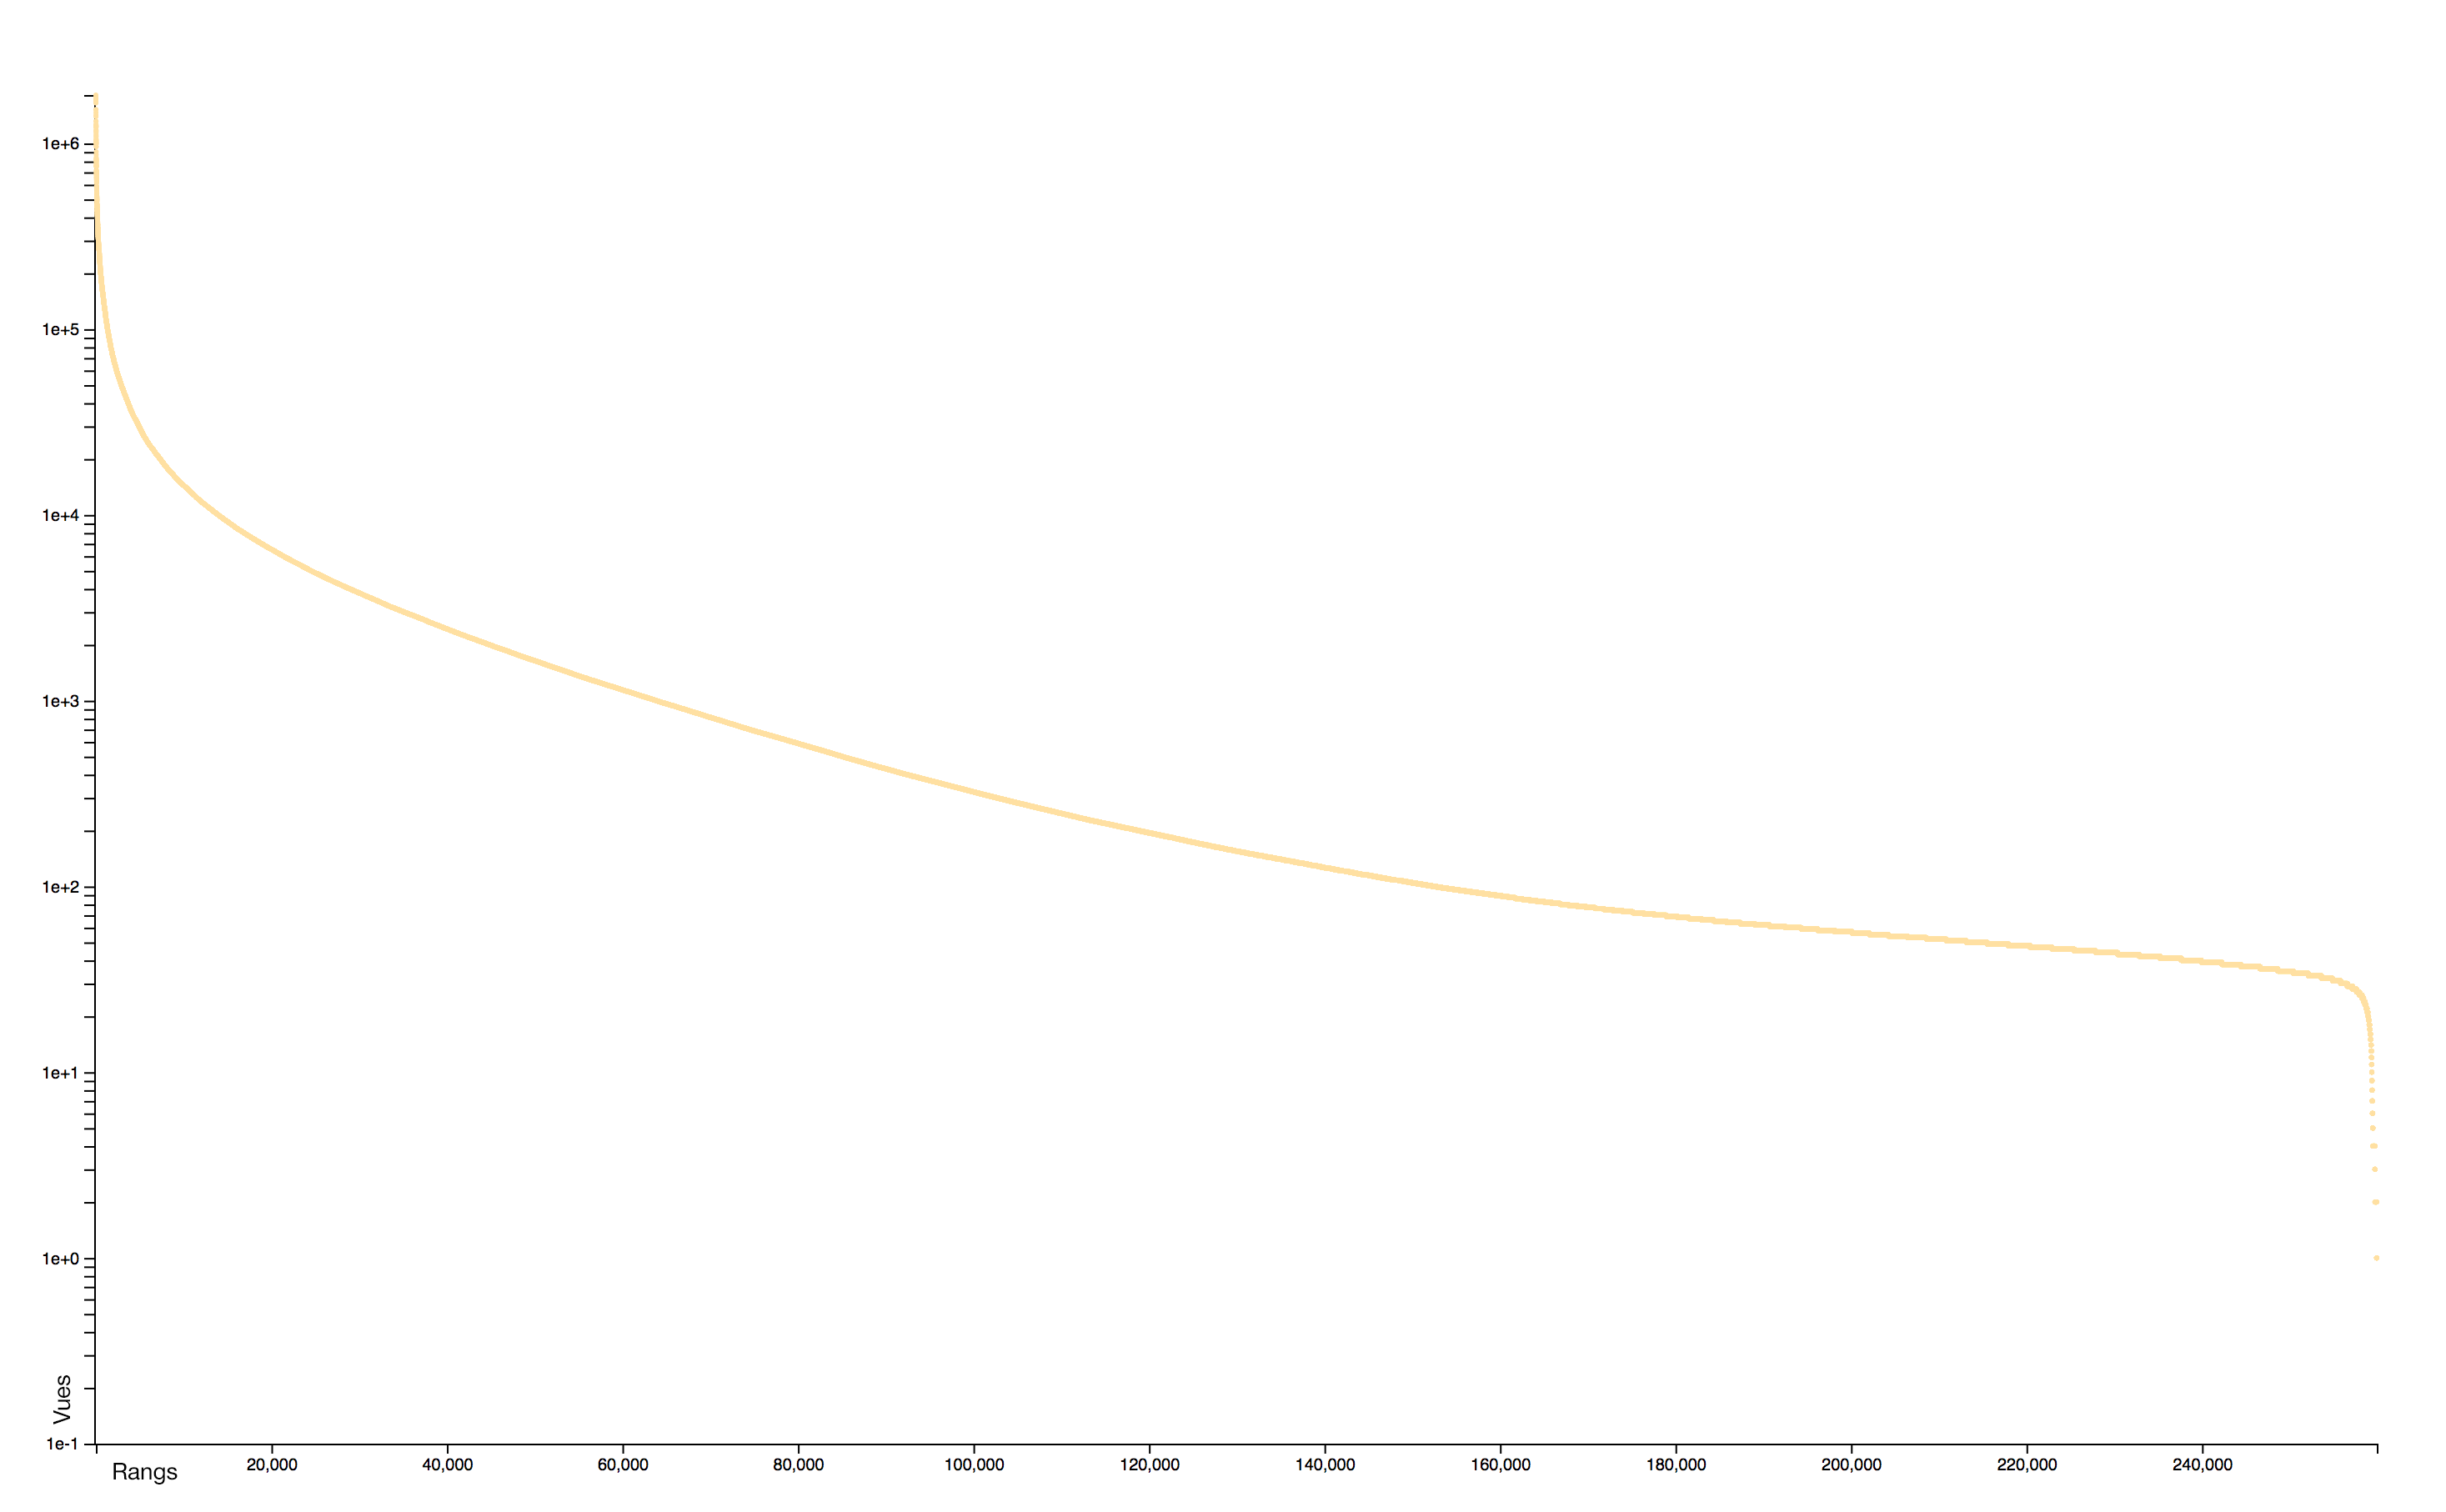
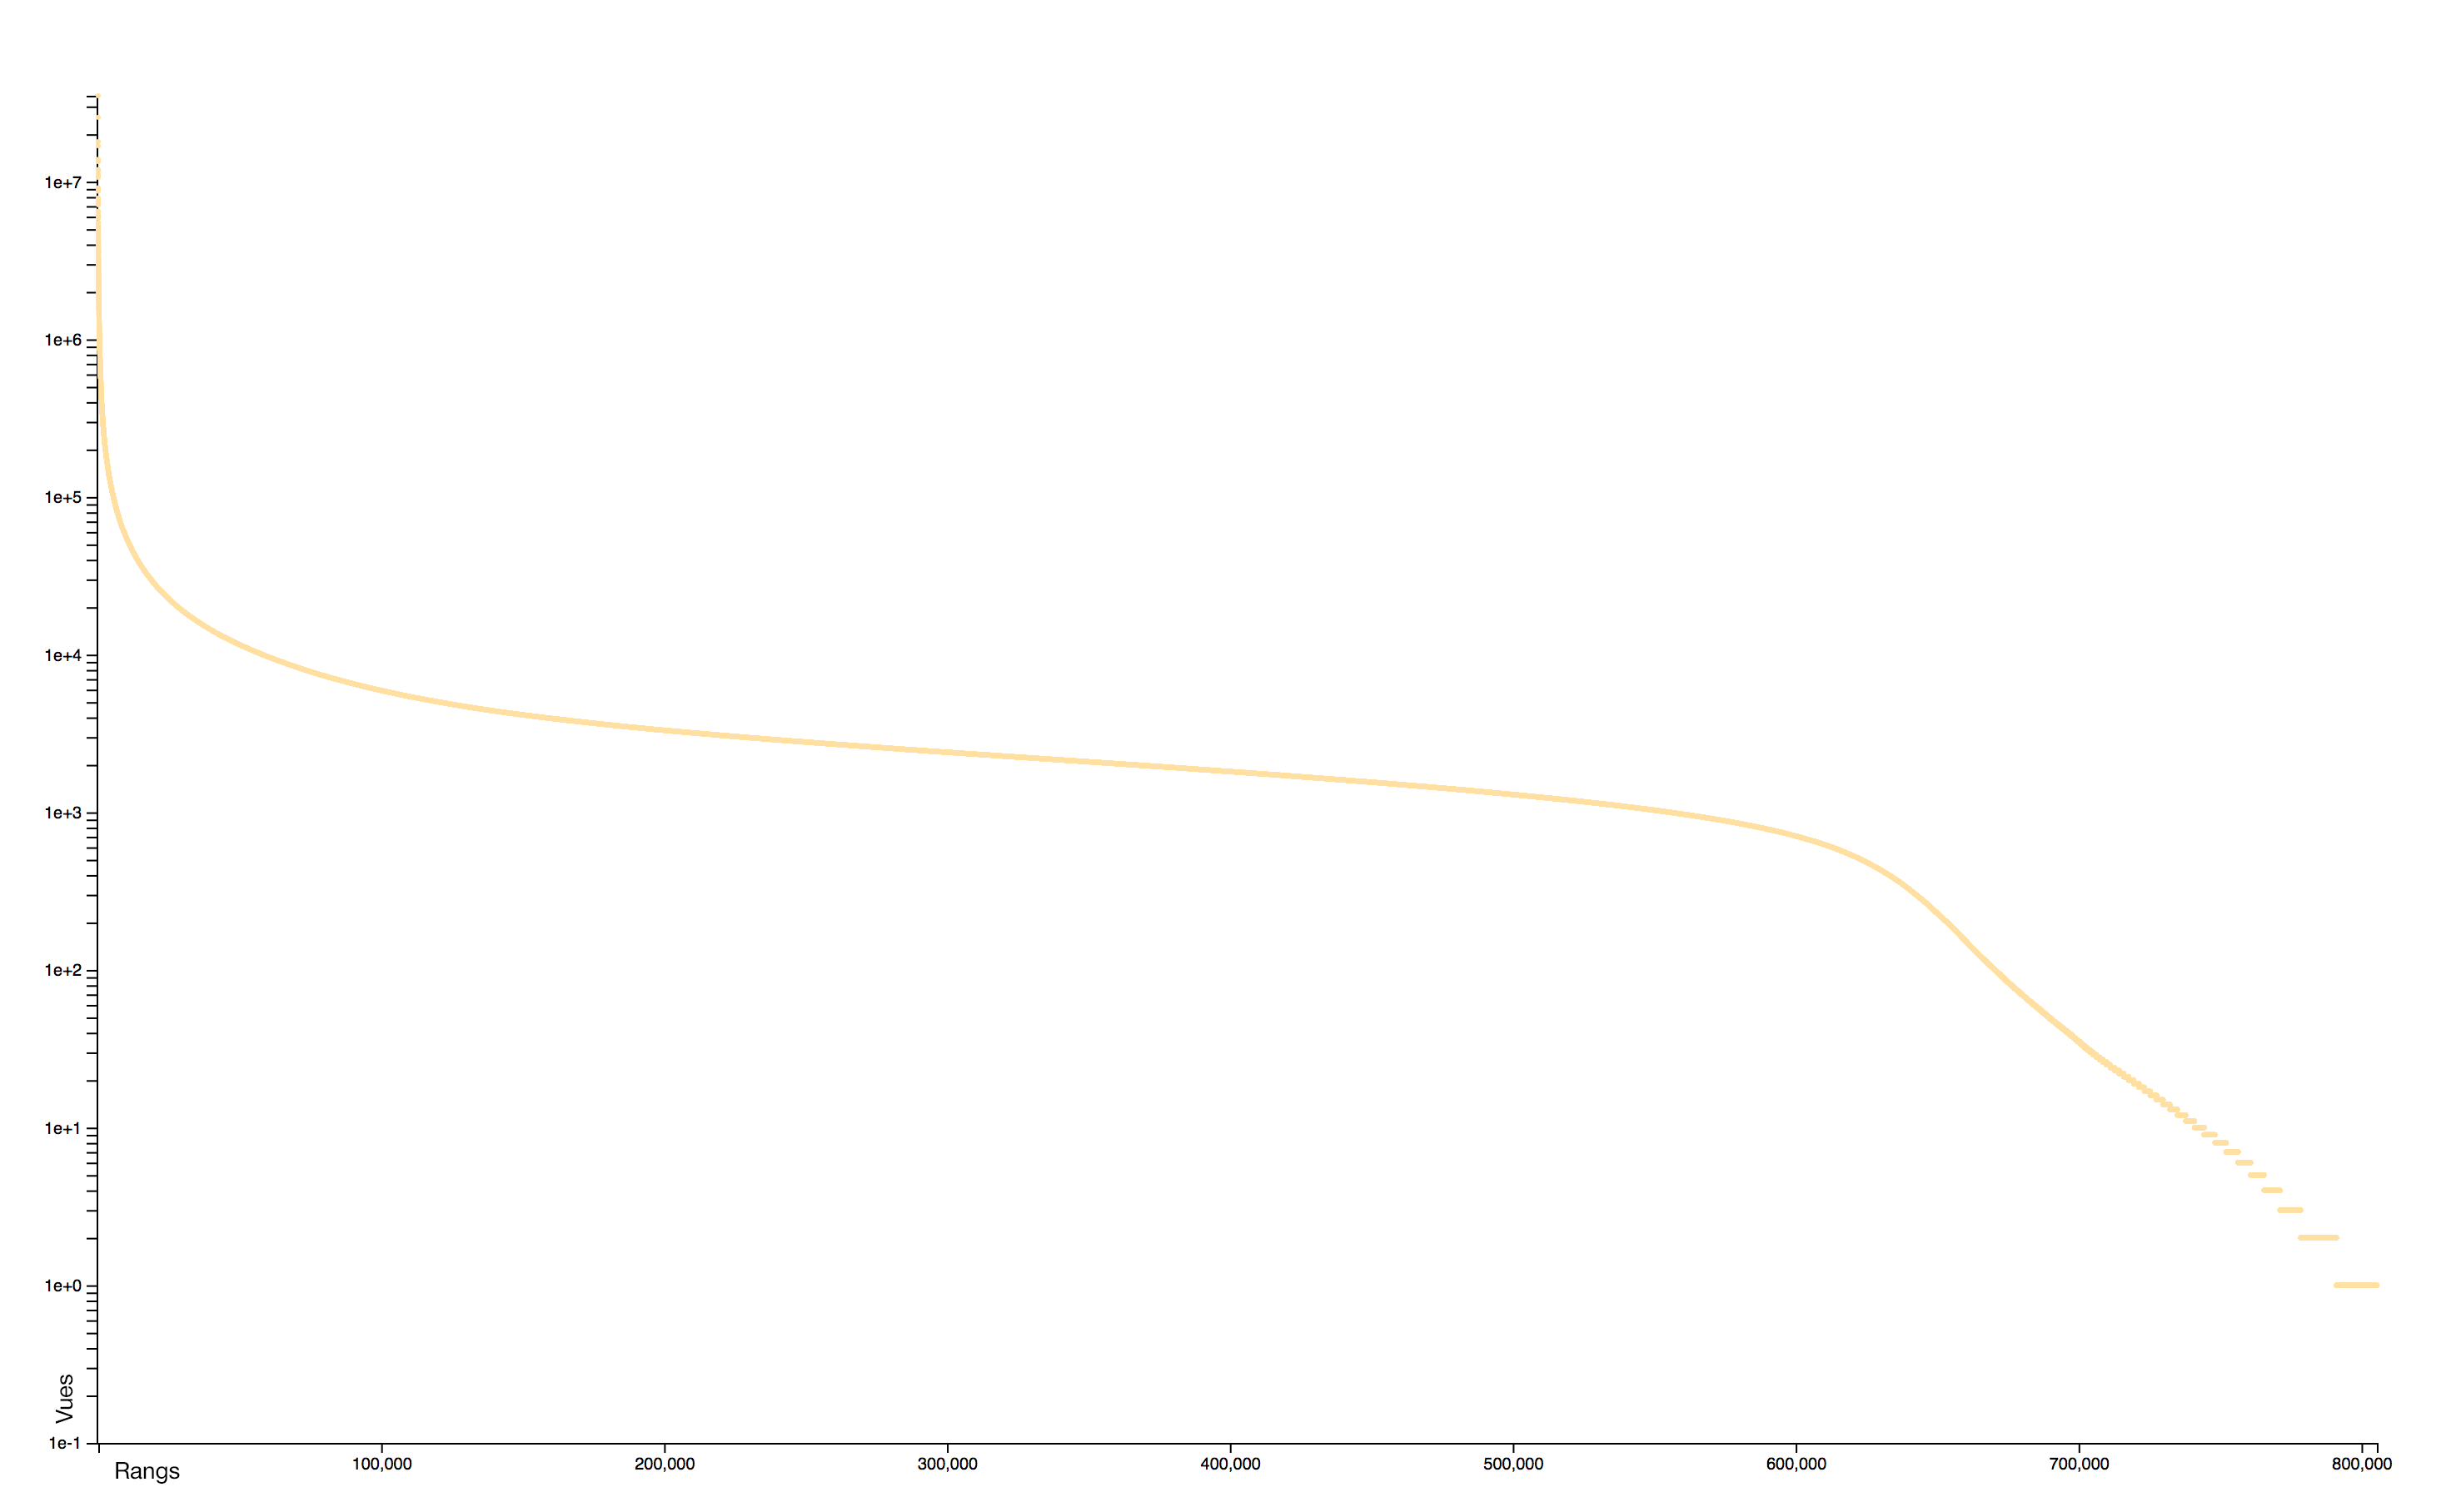
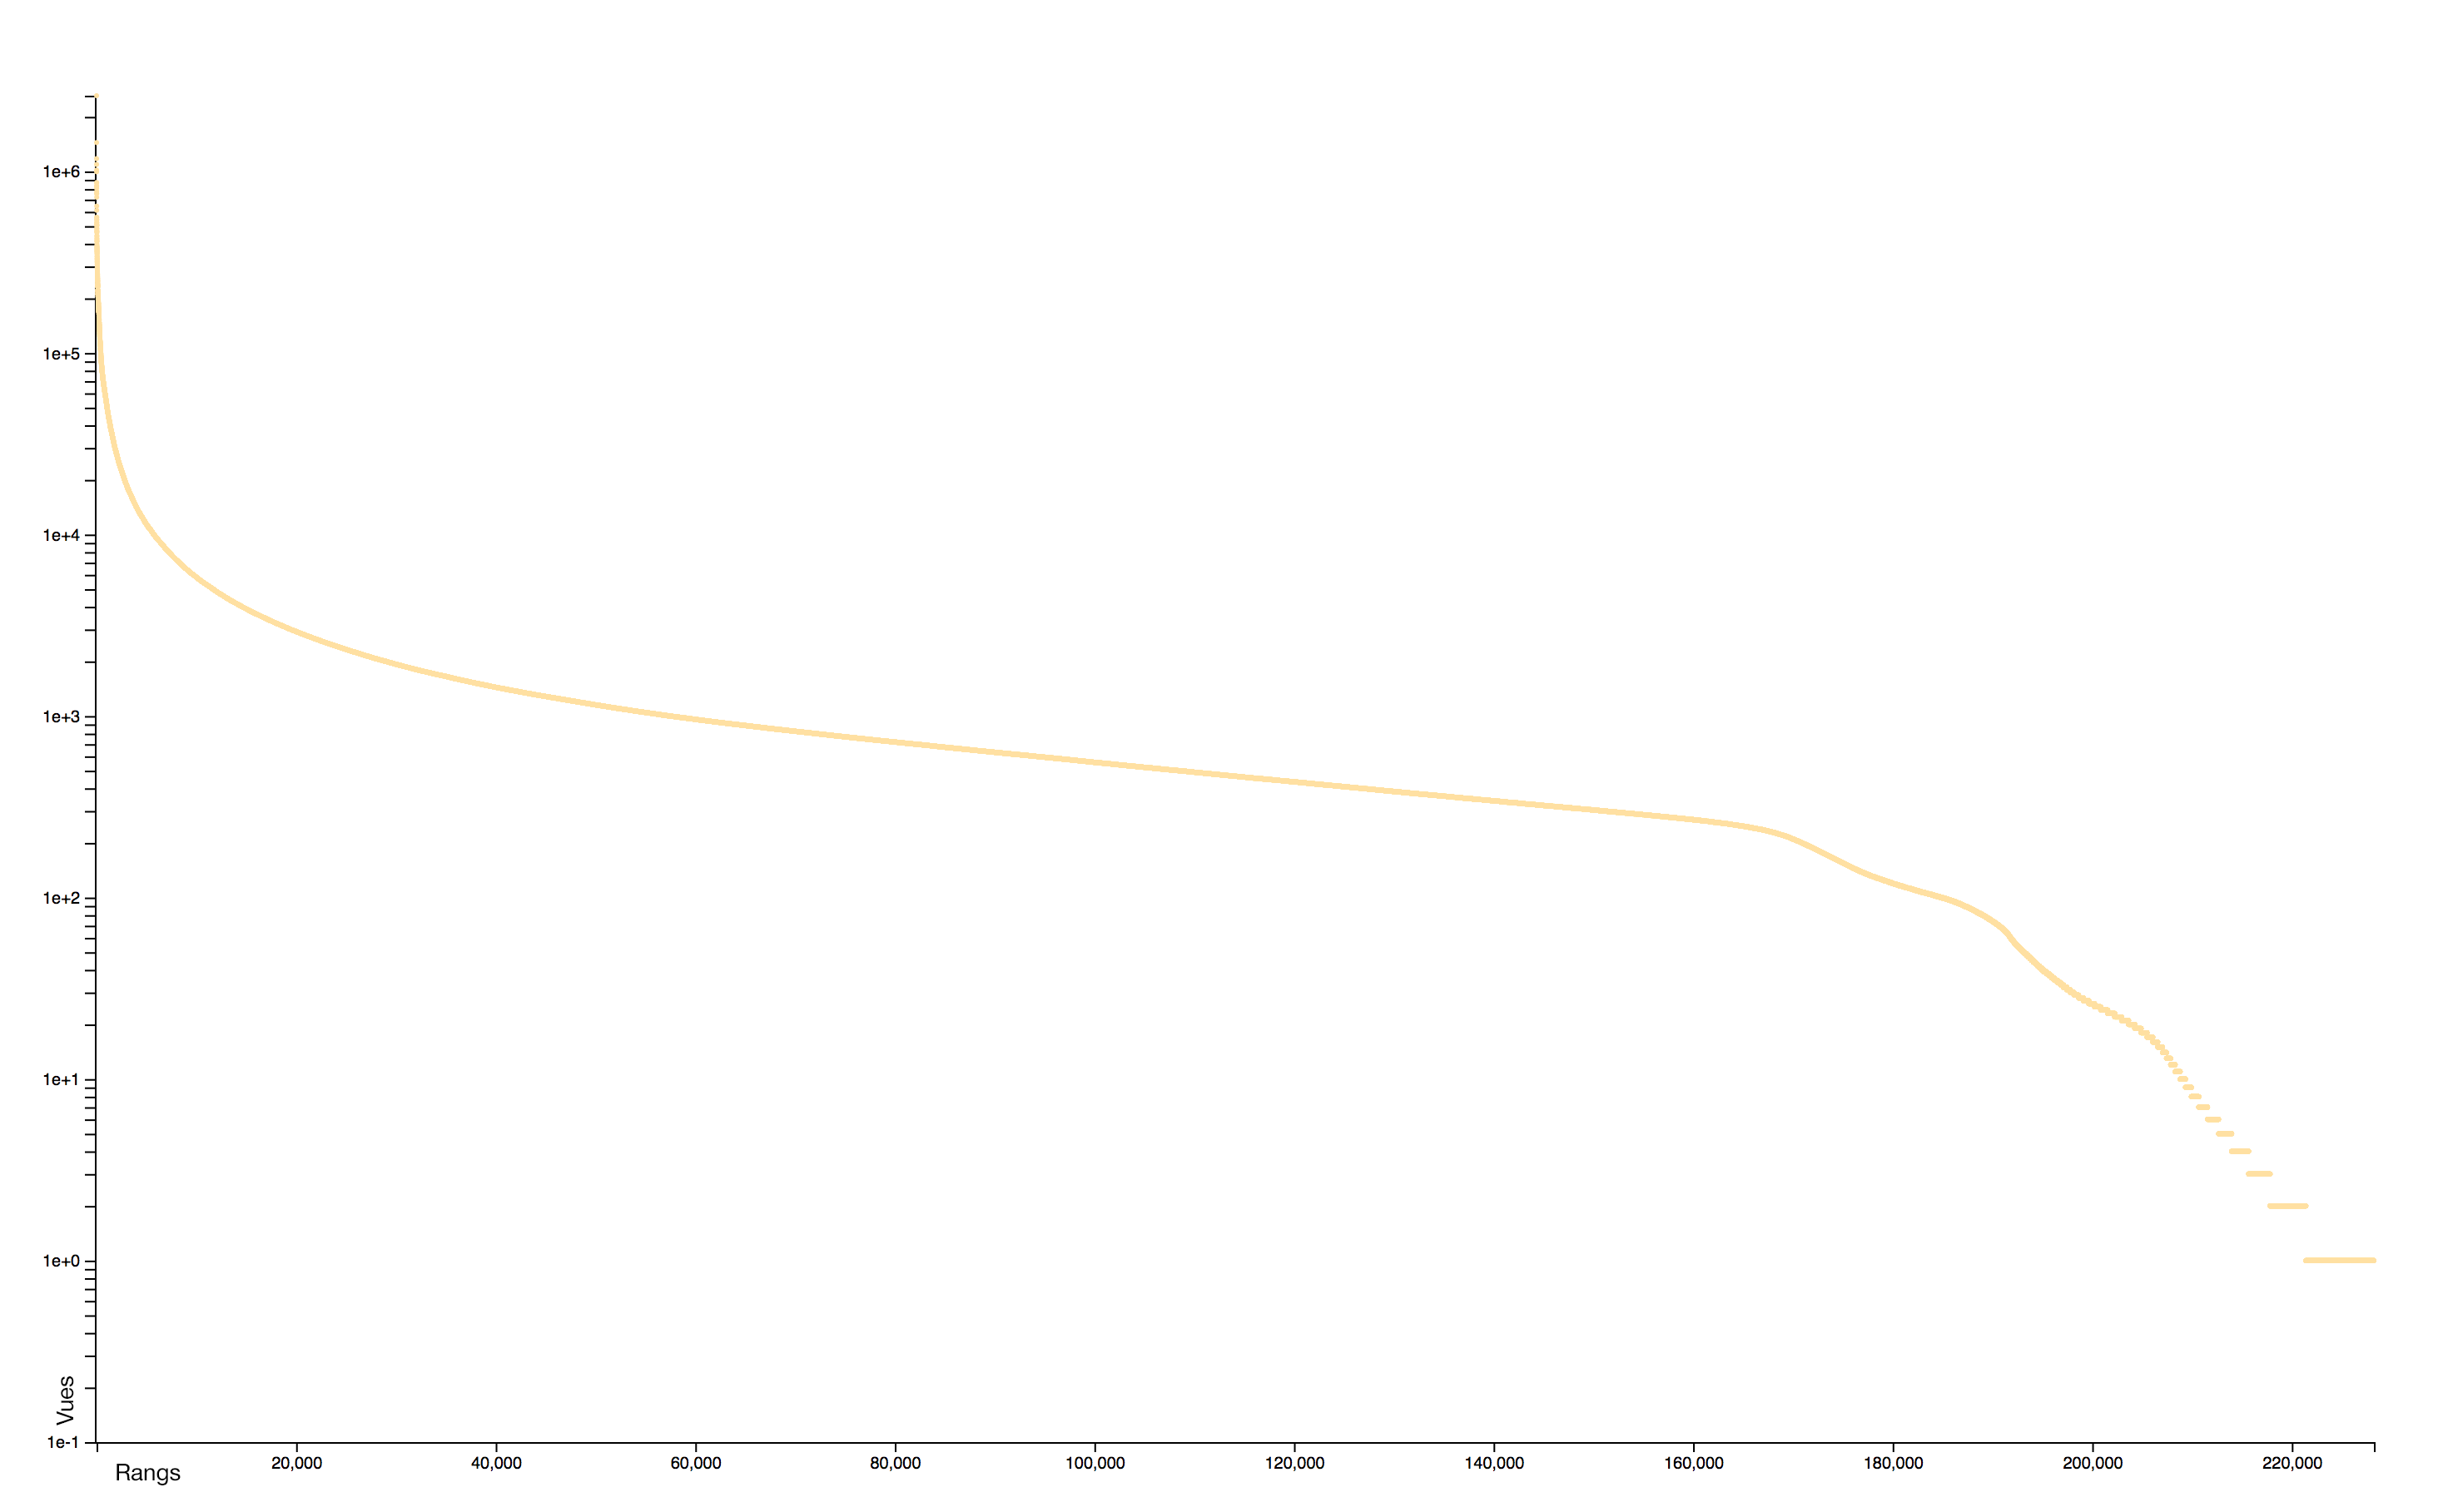
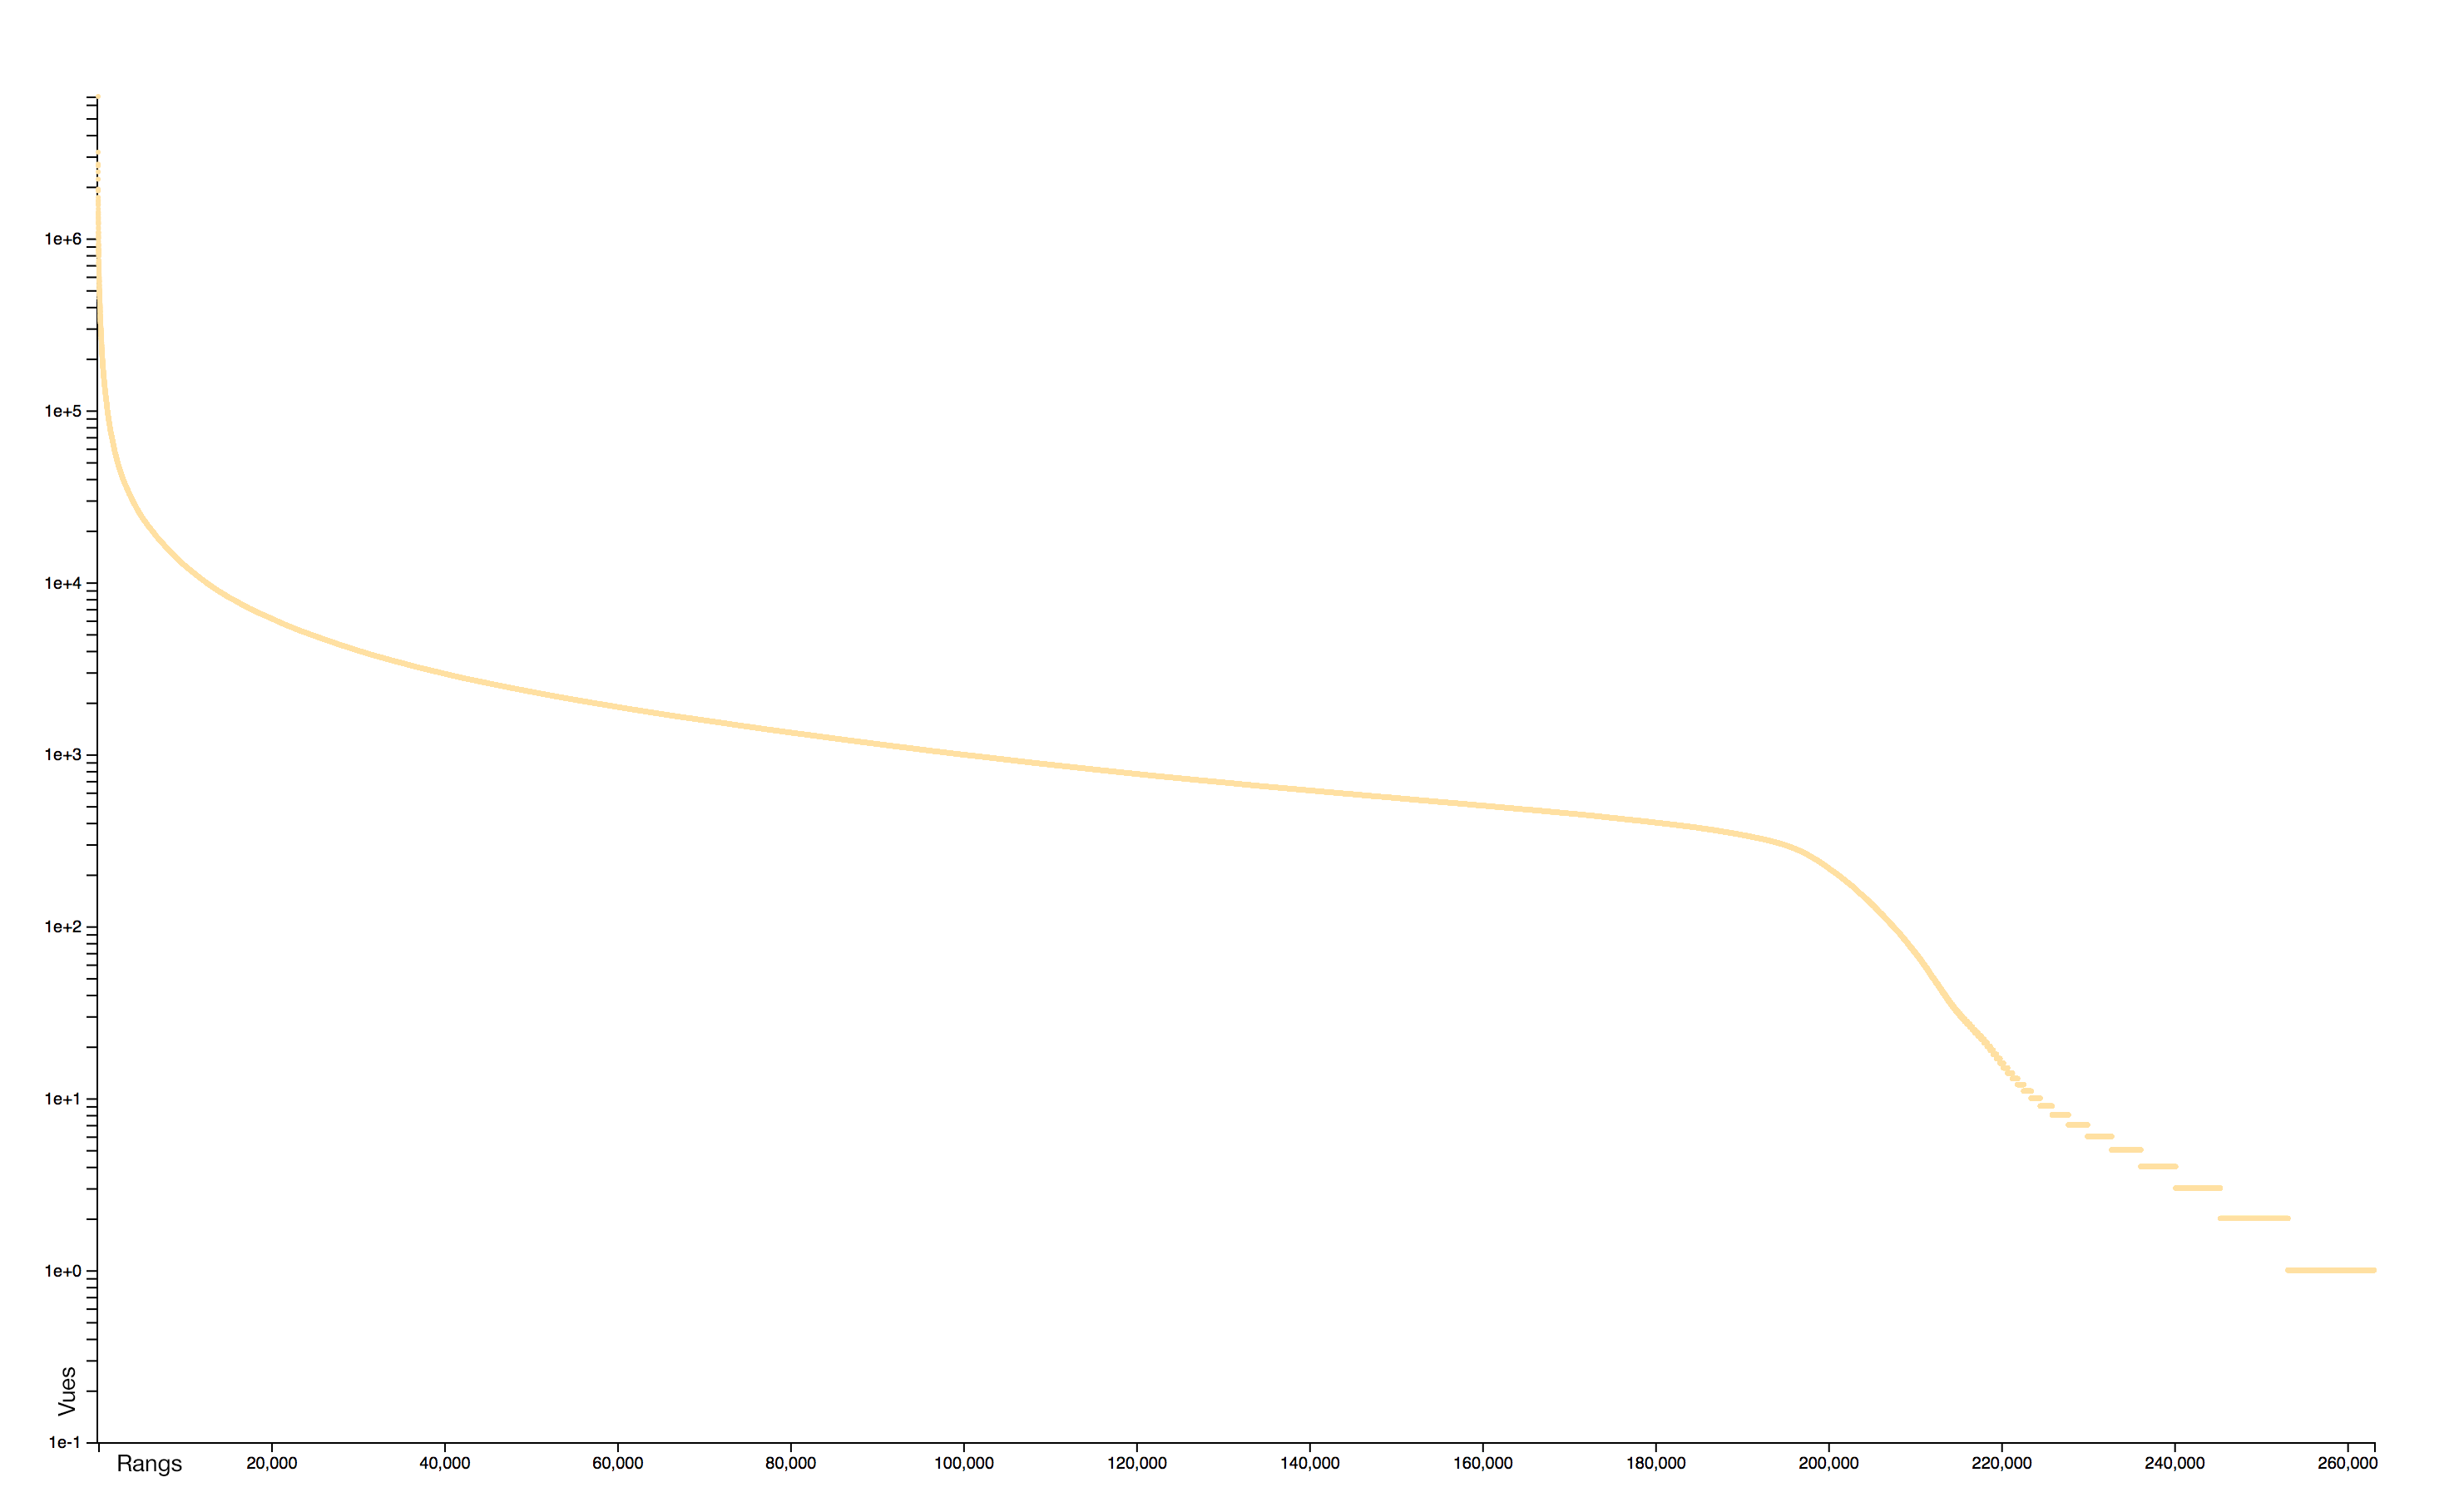
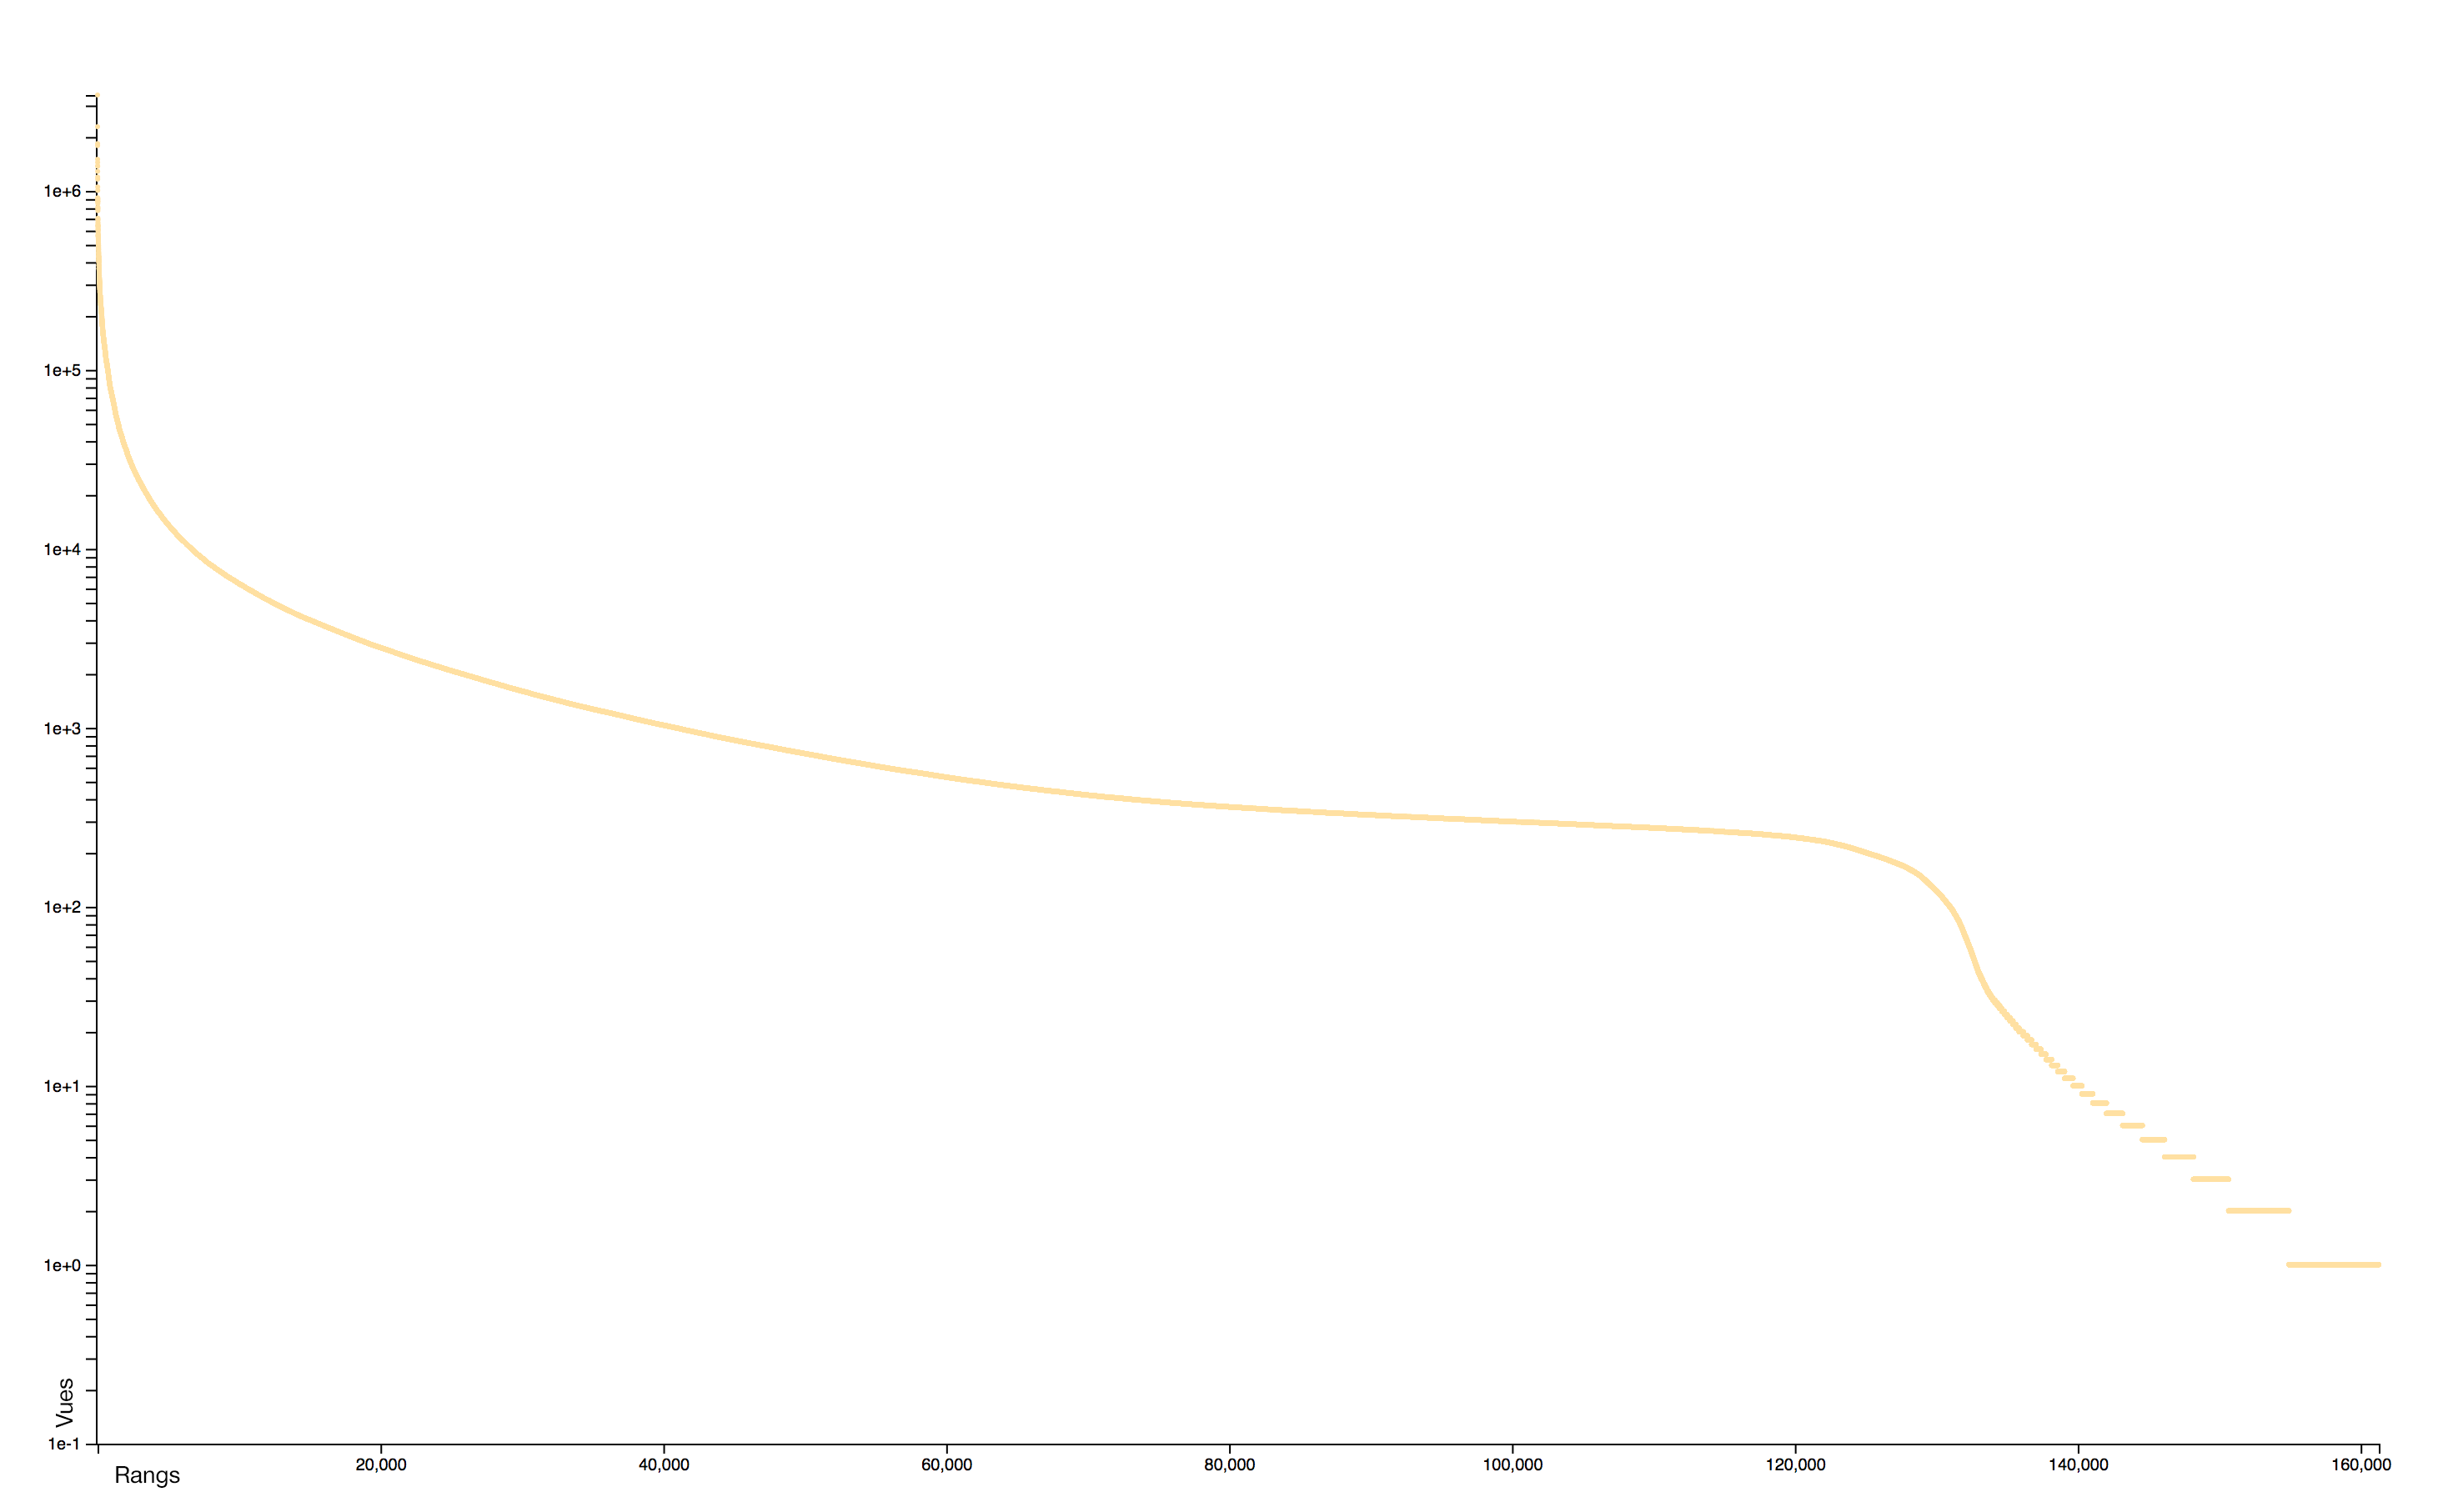
Distribution
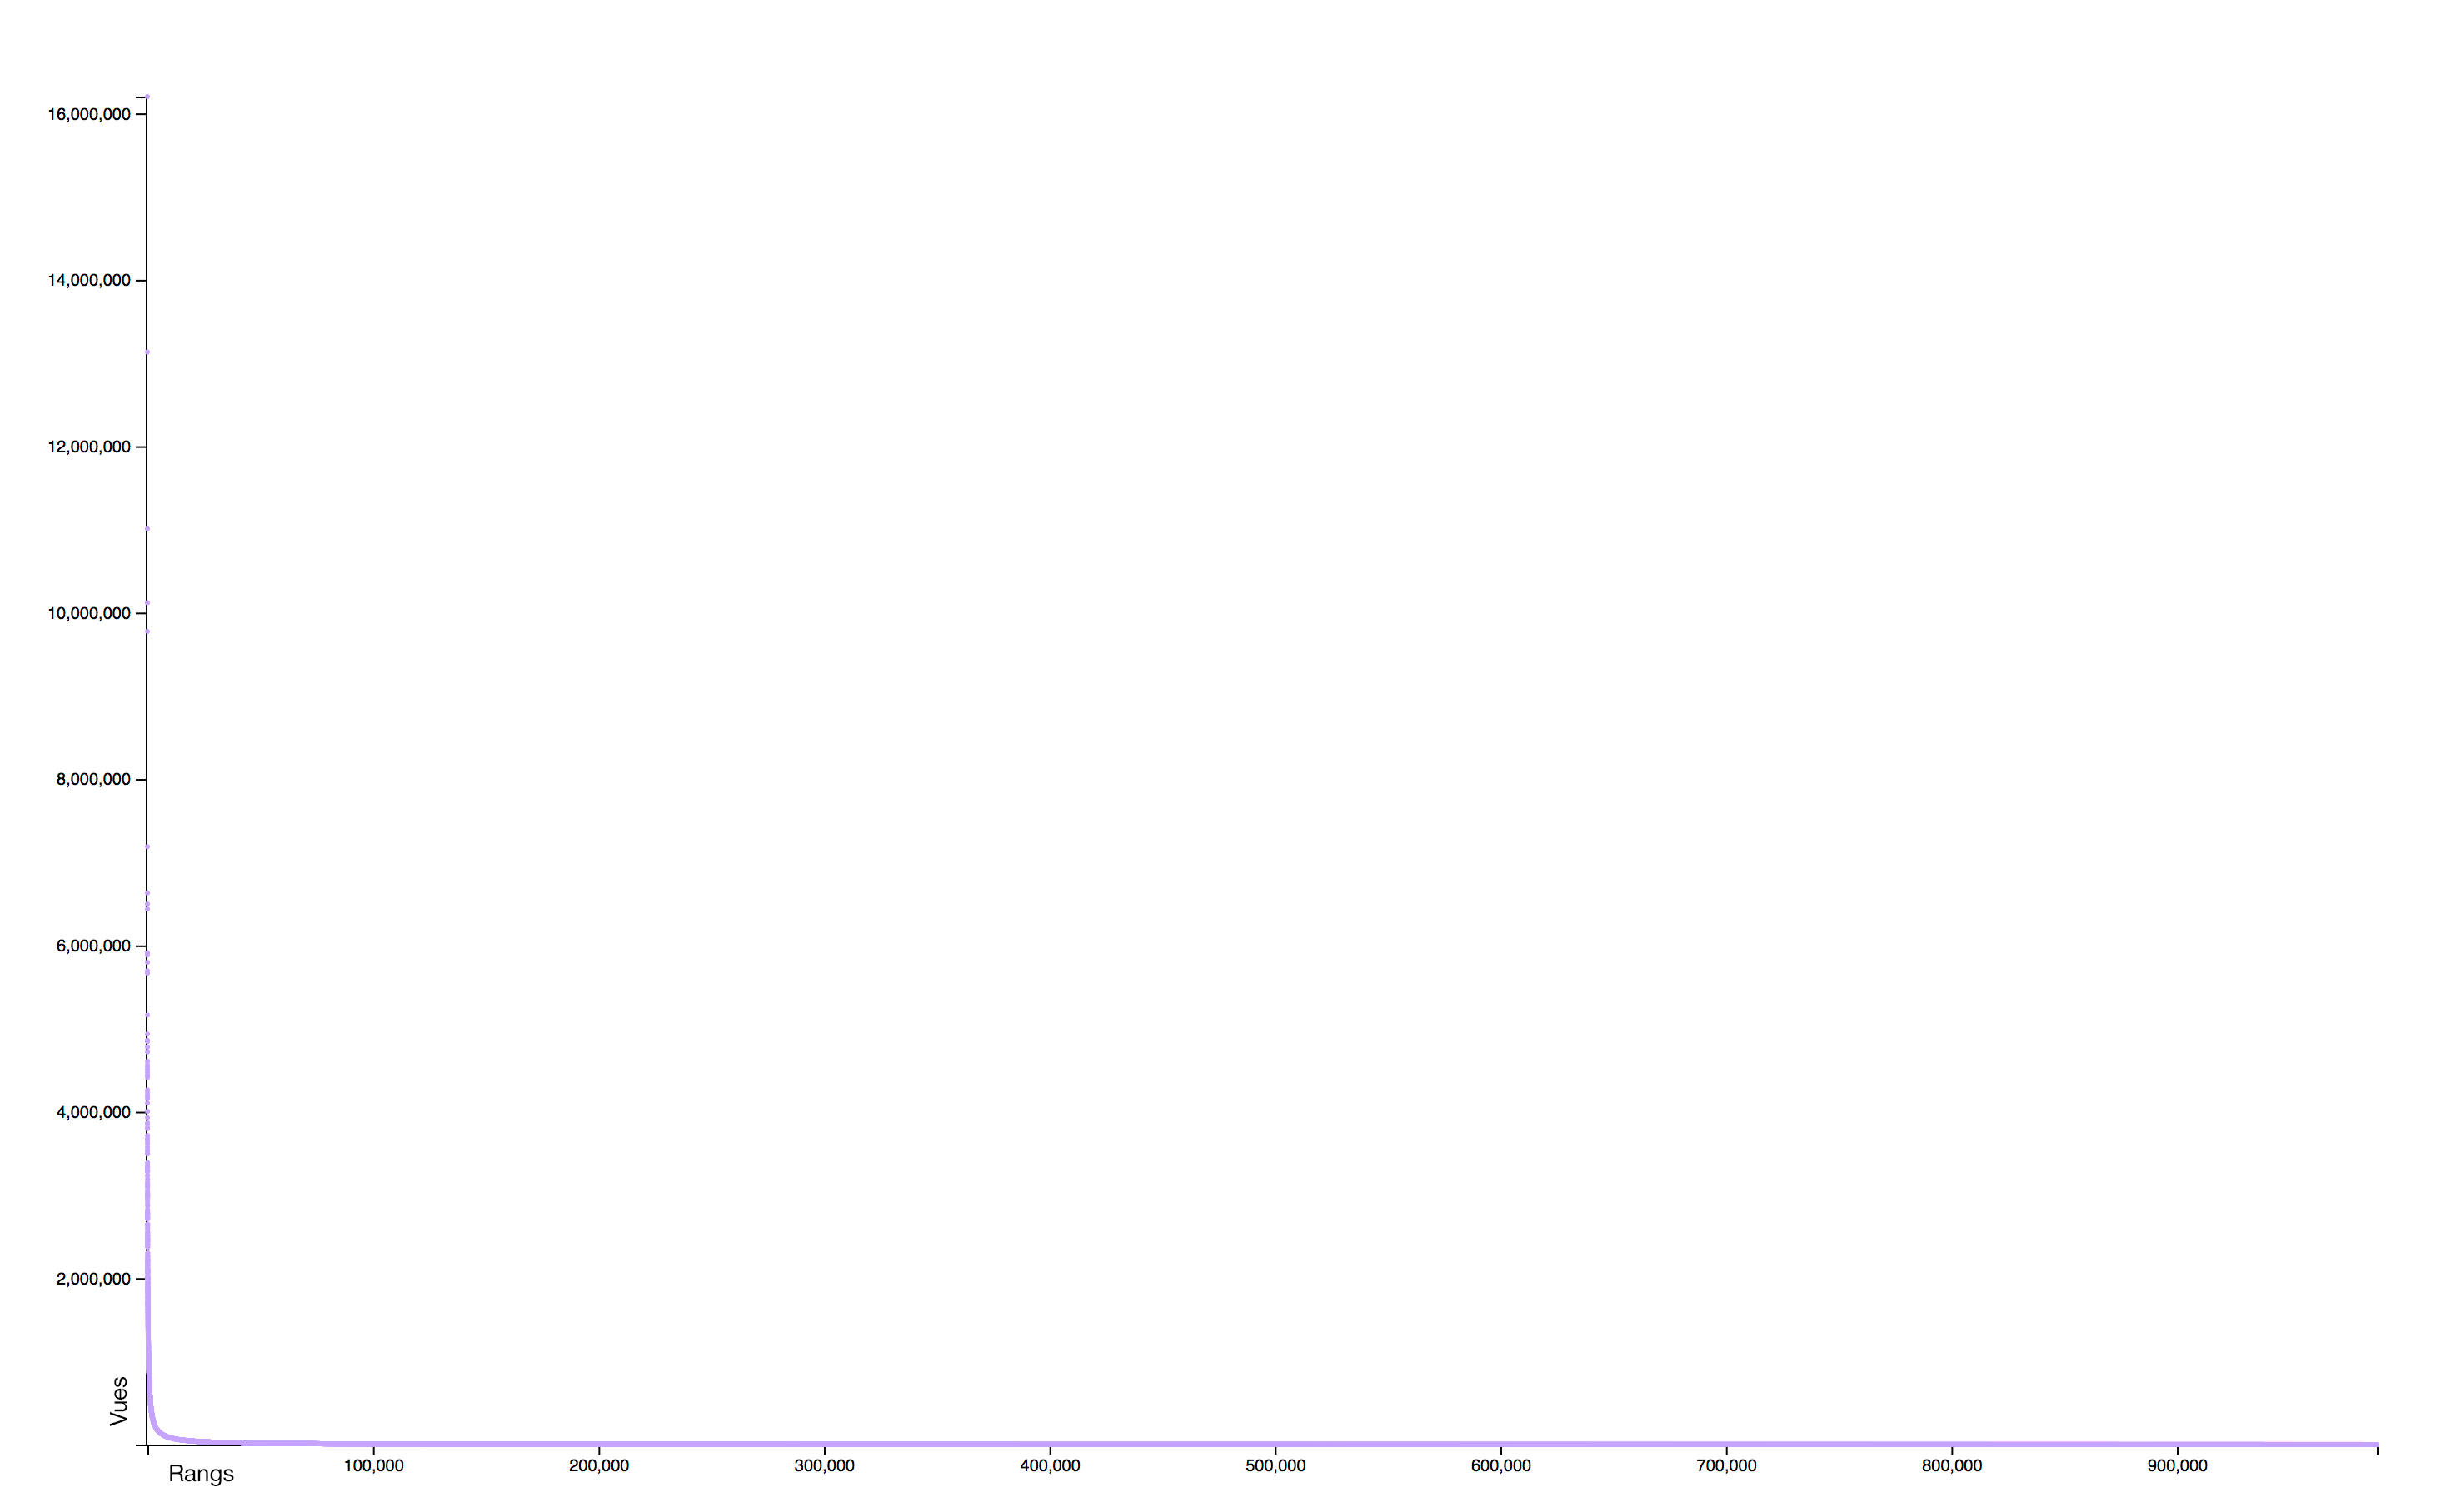
English 2016 (linear)
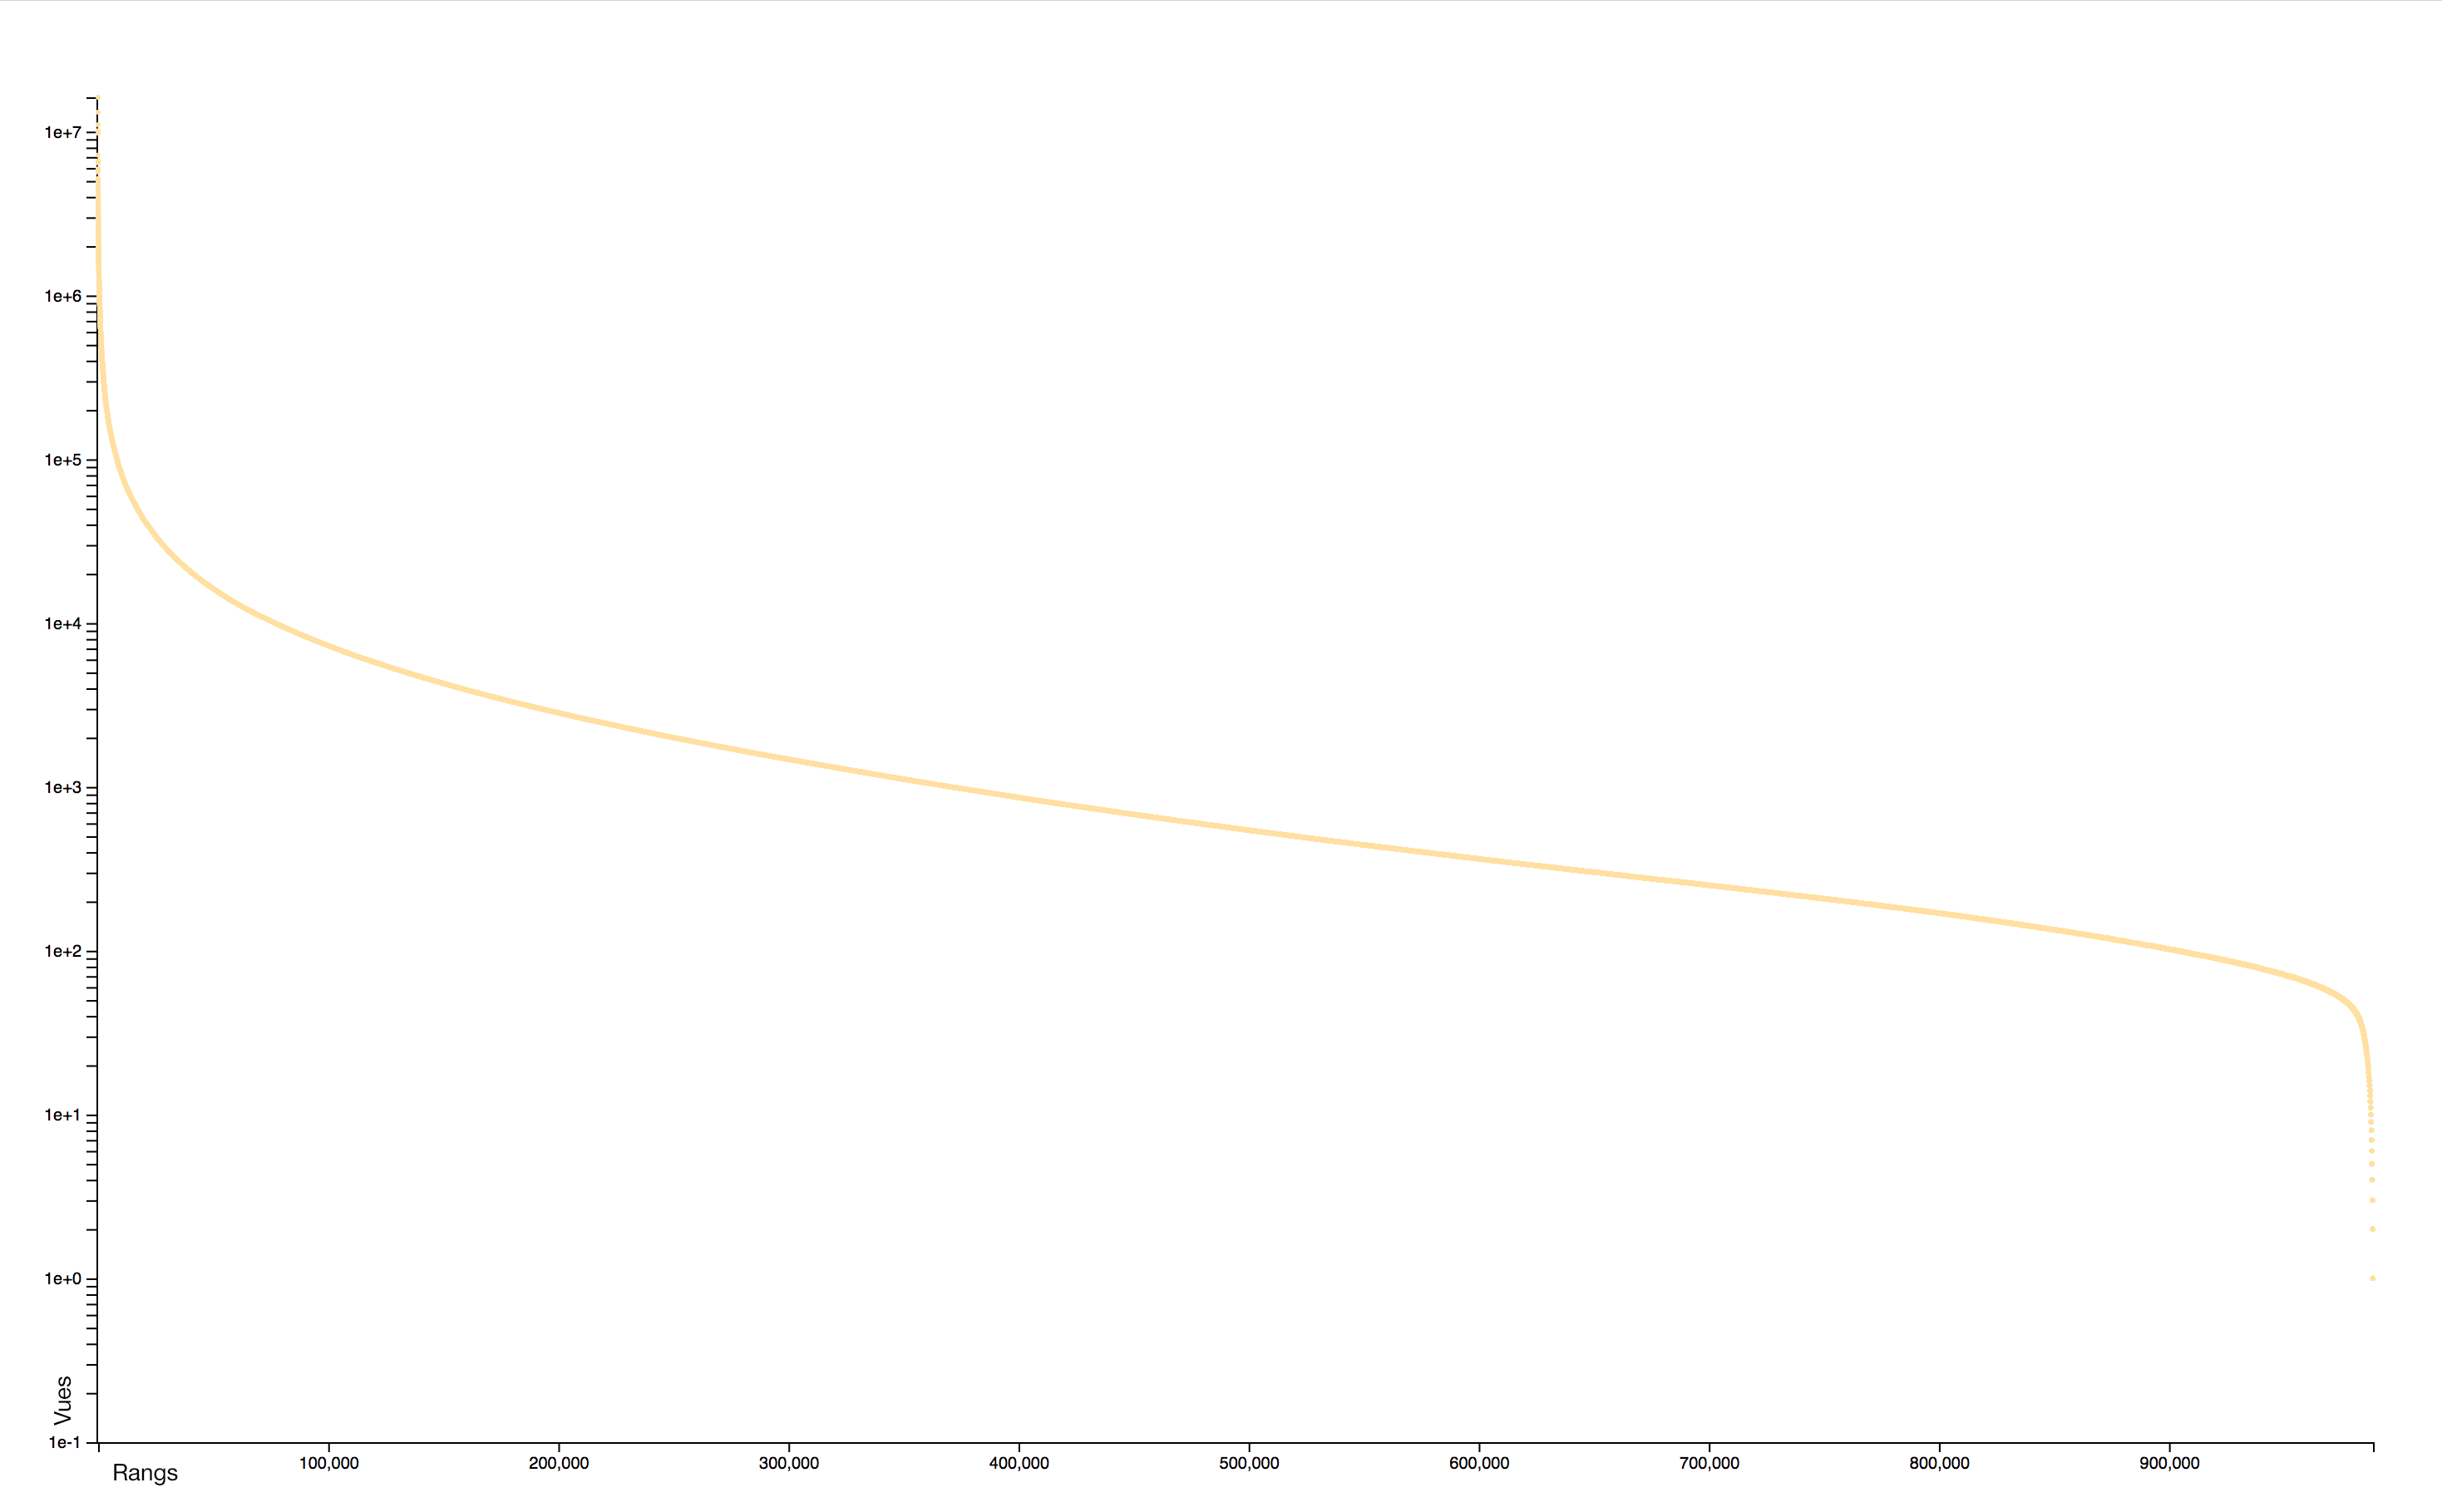
English 2016
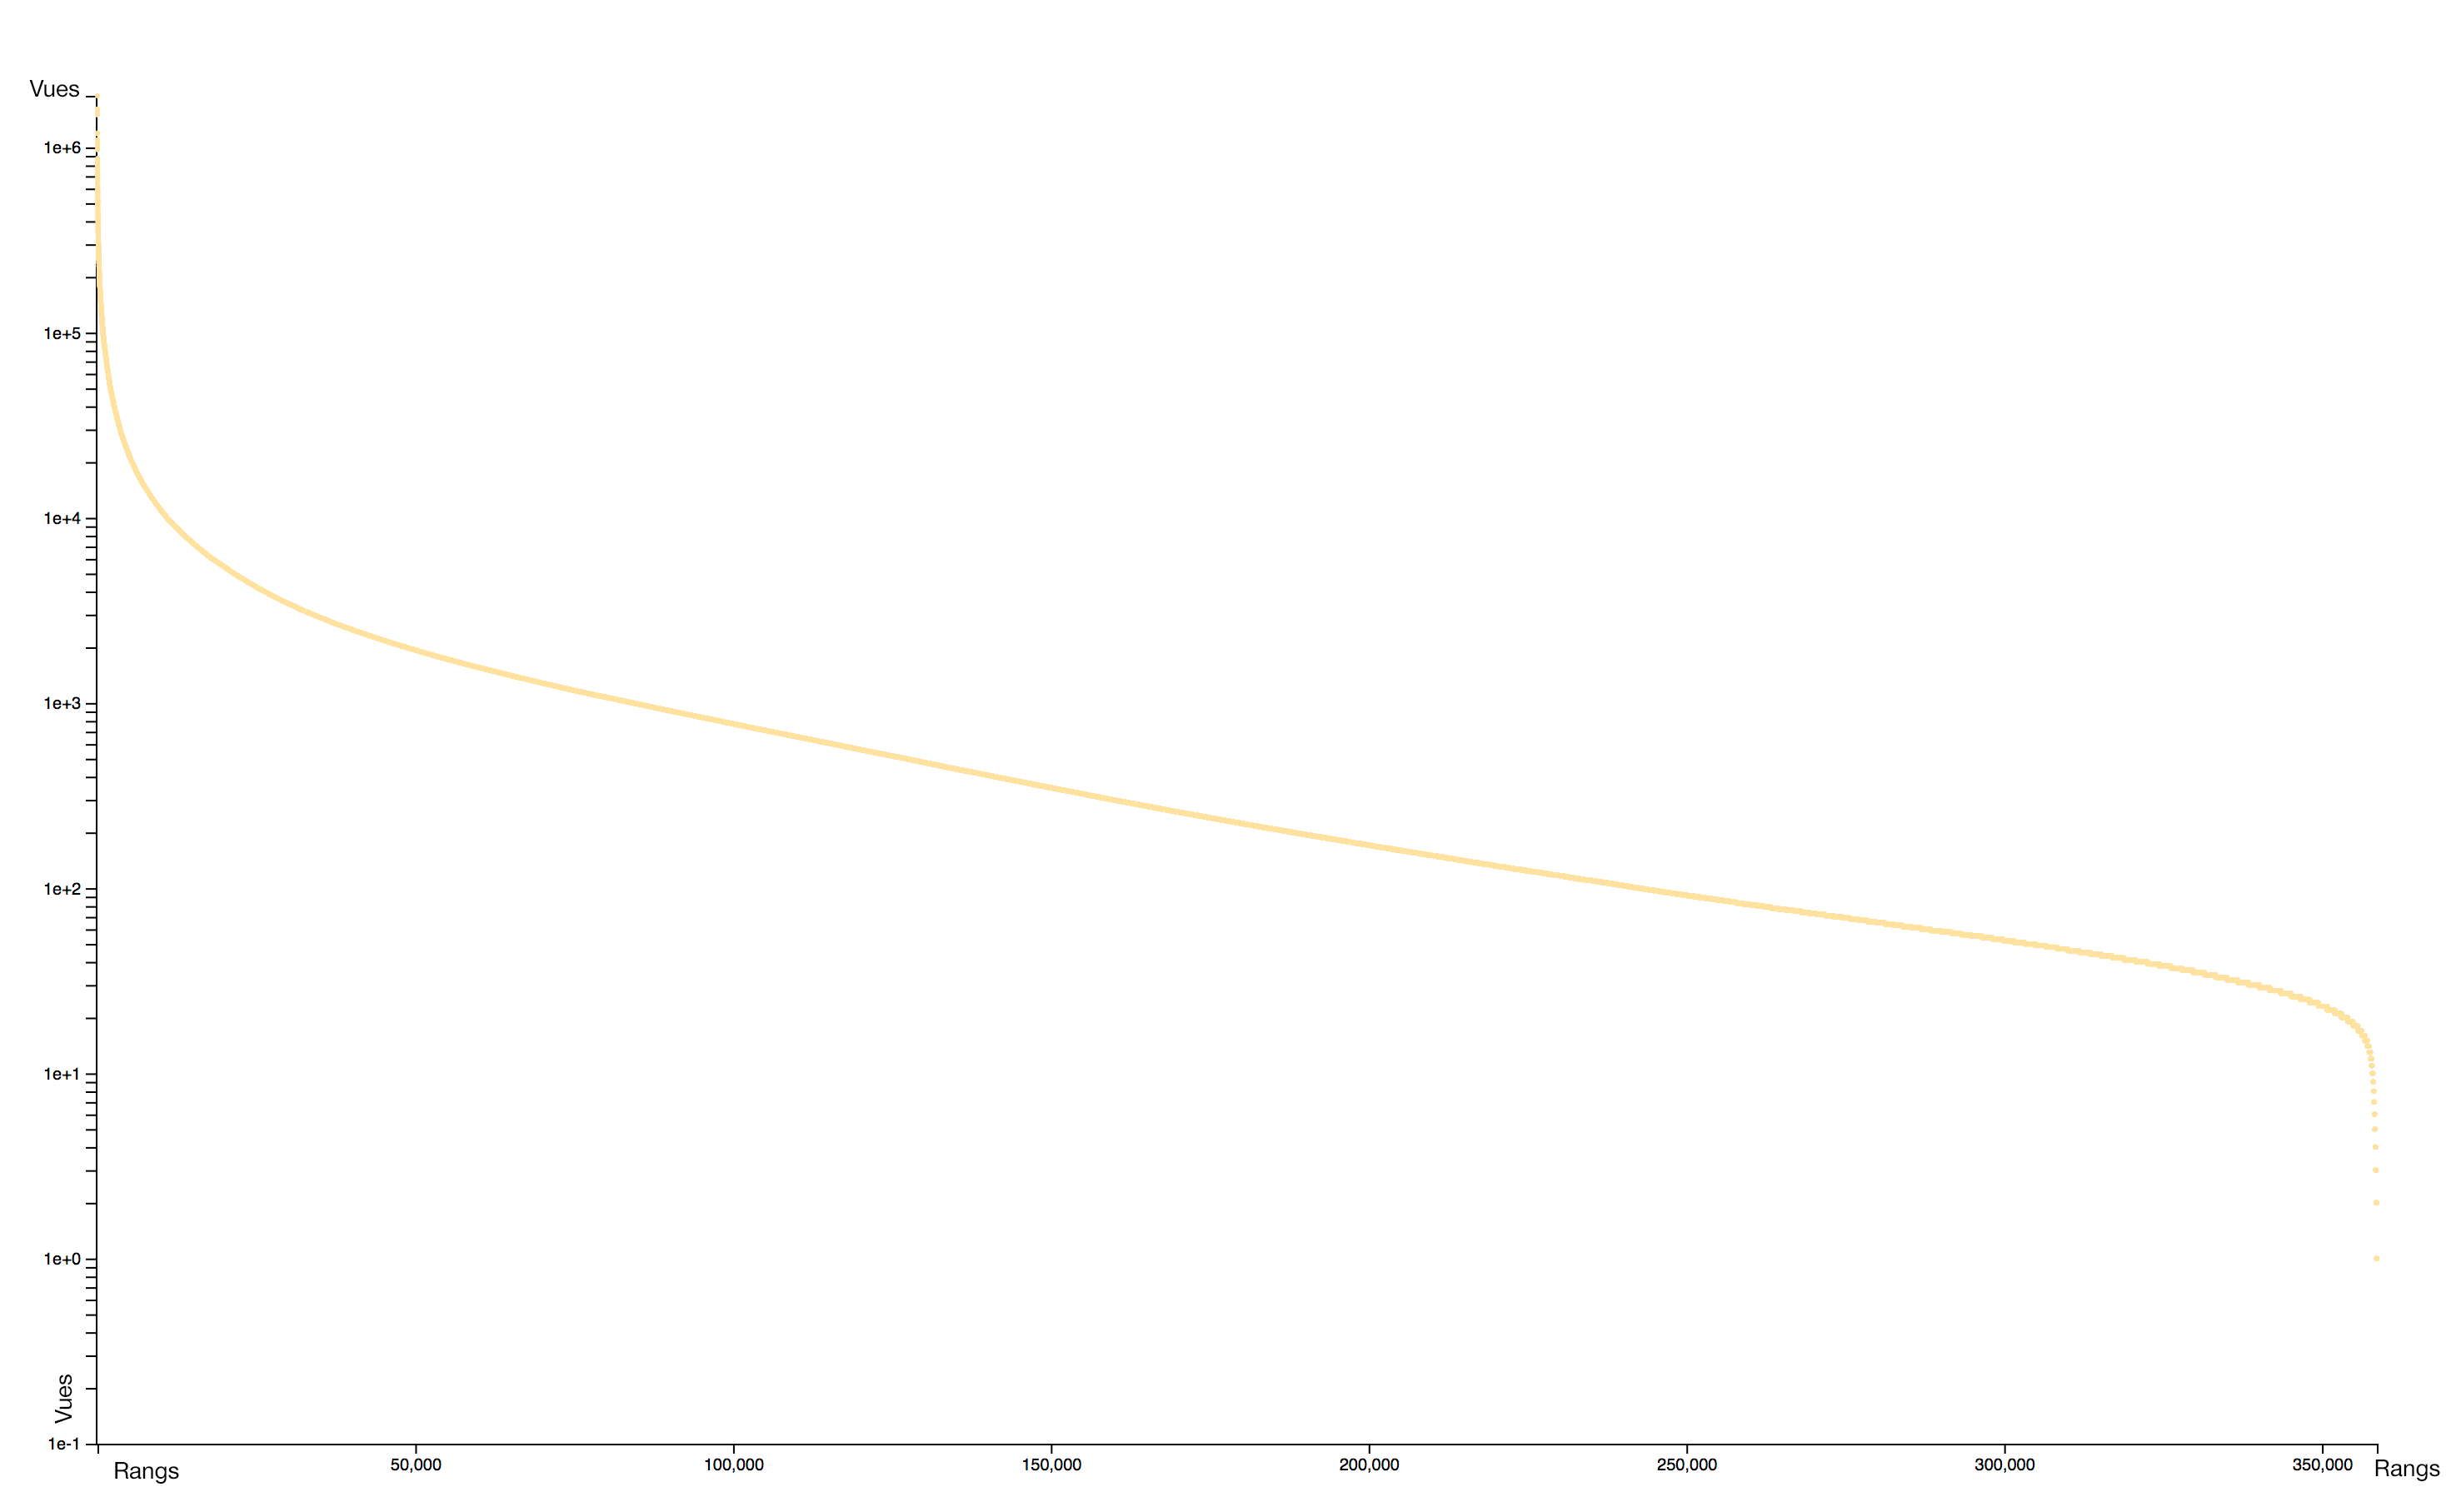
French 2016
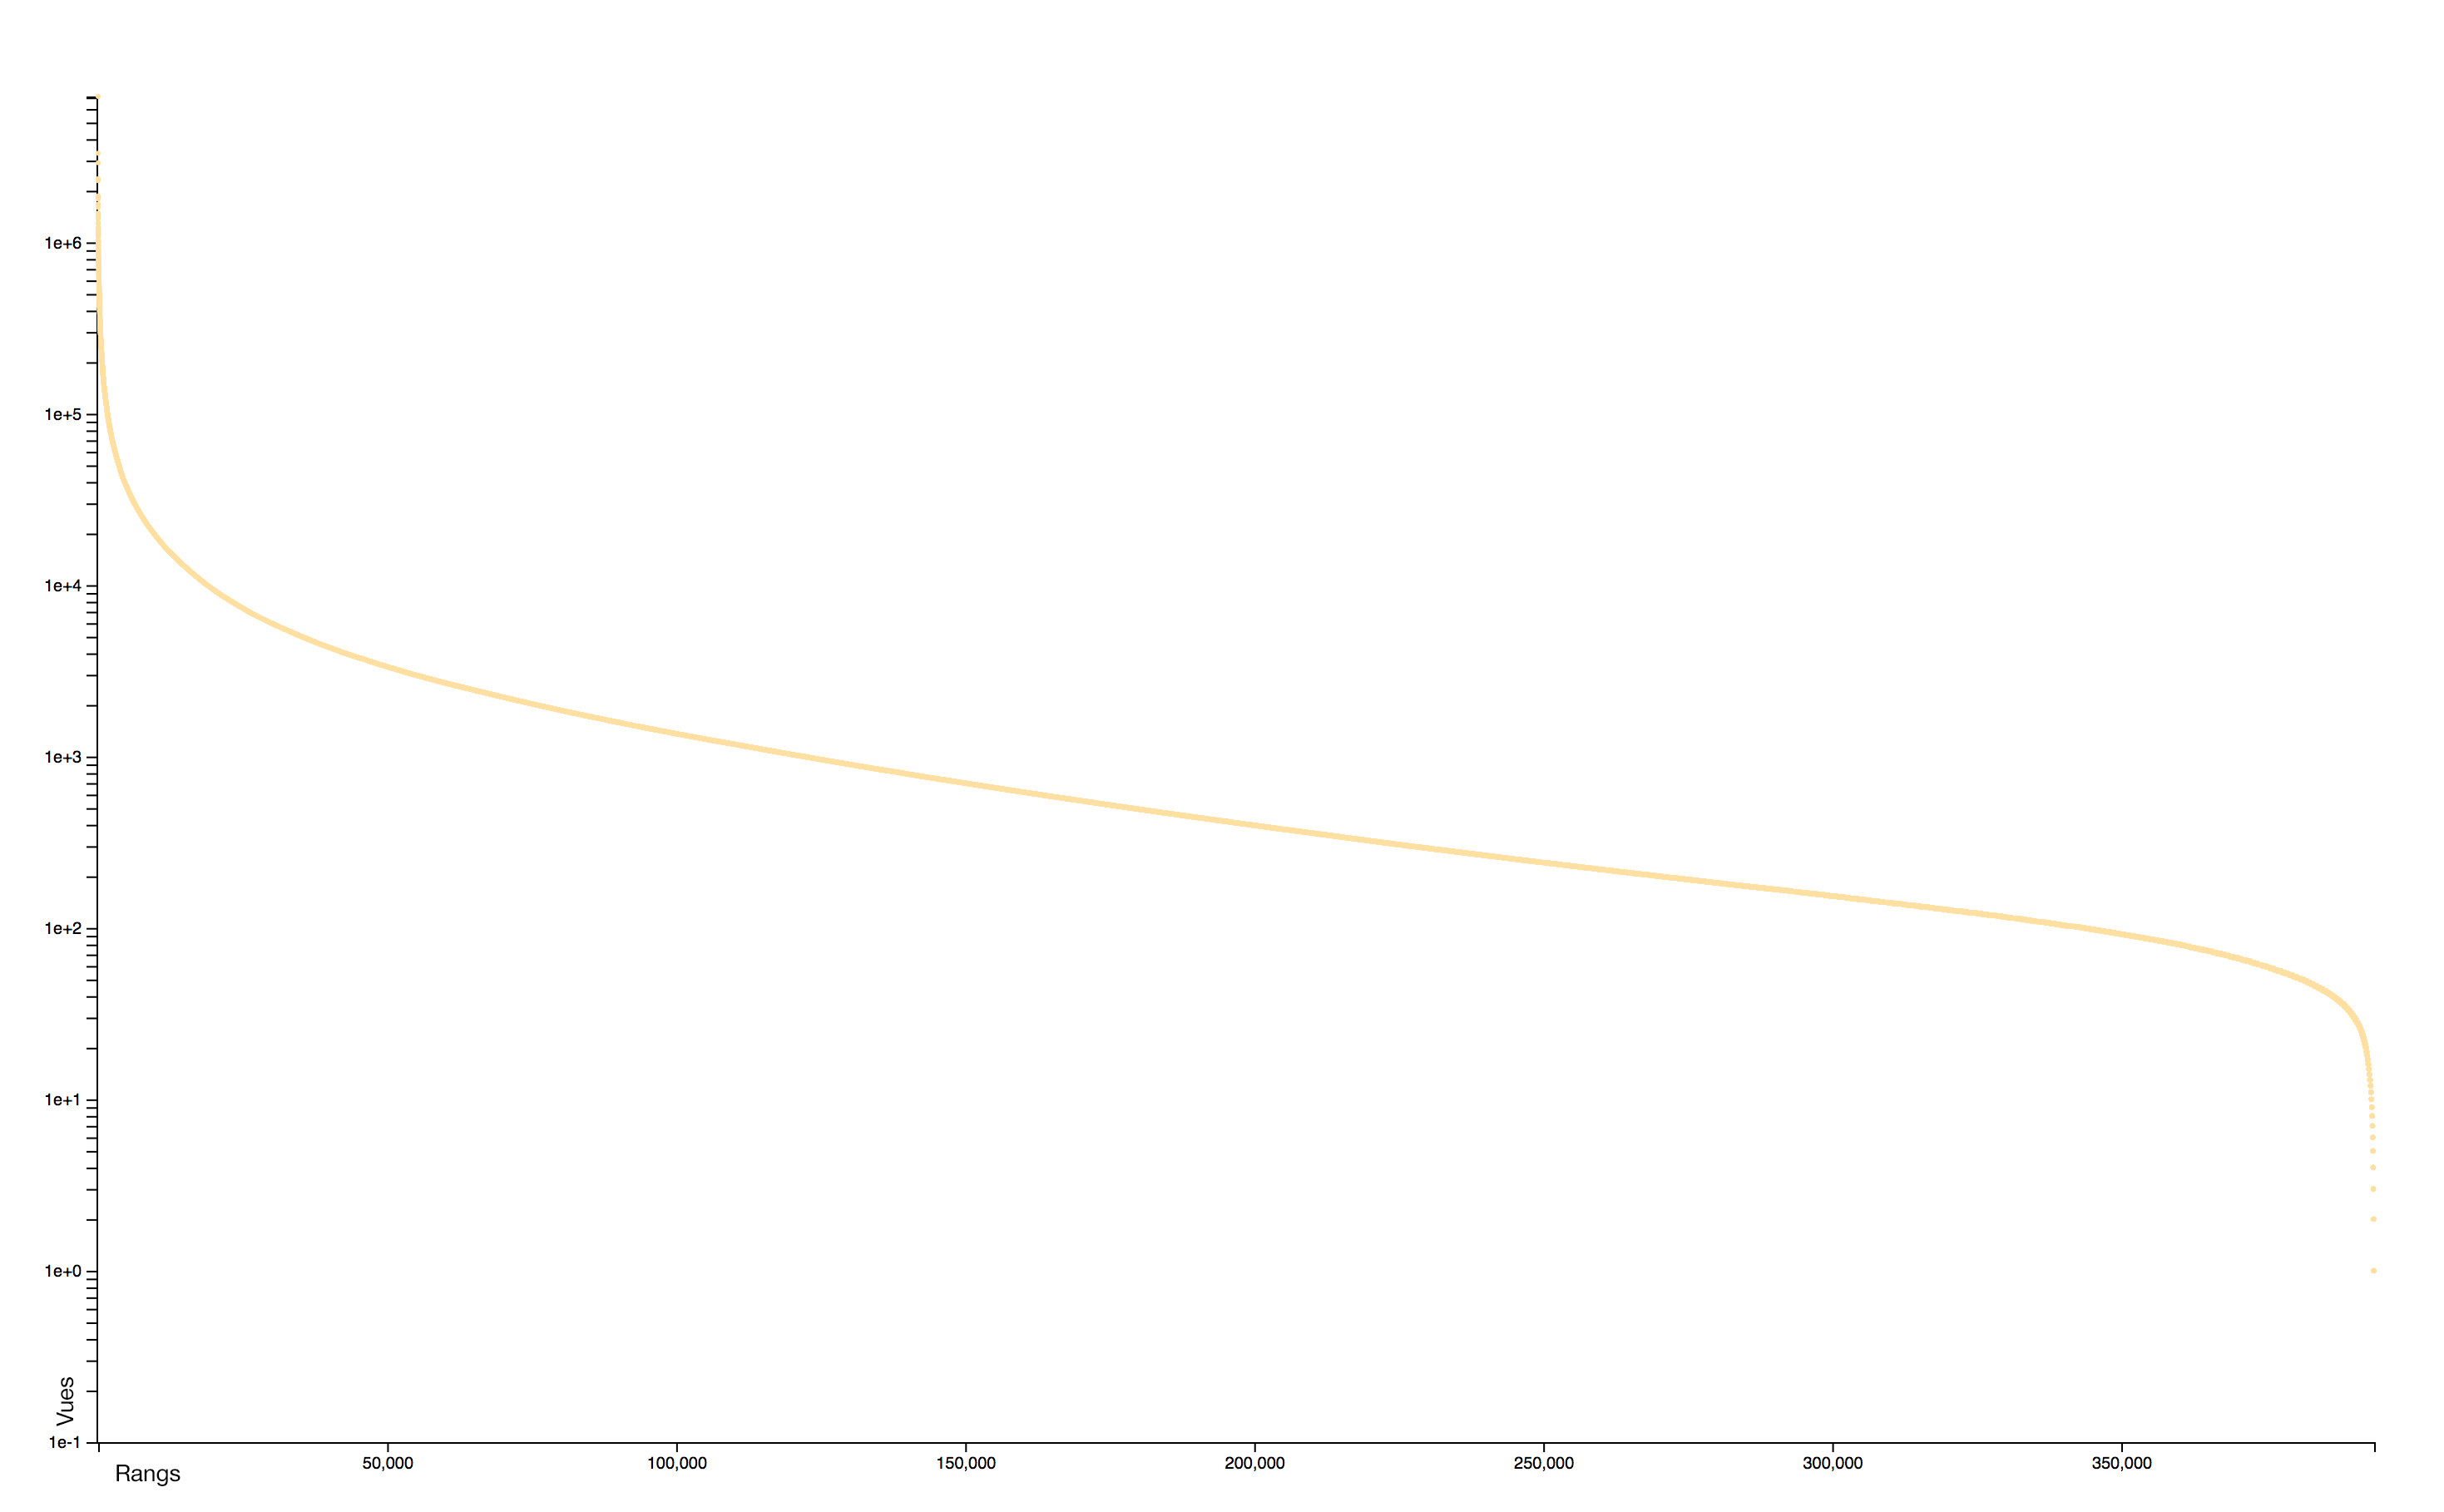
German 2016
Spanish 2016
English 2010
French 2010
German 2010
Spanish 2010
The distribution of consultations is particularly concentrated: very few pages receiving practically all the attention. A logorithmic scale helps to identify two distinct sets: the rare pages that attract most of the collective attention and the rare pages, often newly created, that receive almost no interest.
Interaction
Wikimaps allows you to explore the world at all scales, in the forty main editions (languages) of Wikipedia and over the last twelve years.
For a particular language and year, it is possible to have the list of the most consulted places and to visualize the daily evolution of the interest that they aroused.
The prototype has a dynamic mode which allows to visualize the evolution of the attention in the whole world in a particular edition.


